


The recent evolution of airport terminals has been prompted largely by different patterns of passenger behavior in a post-9/11 world. Passengers have learned get to the airport earlier. They spend less time browsing pre-security retail, opting to queue up in often-lengthy security lines well before boarding. The result? Overcrowding in post-security areas, where retail and dining options have historically been lacking.
Curtis Fentress, Principal-in-Charge of design at Fentress Architects, says greater passenger volume has strained gate and restroom capabilities. In addition, the recent popularity of low-cost airlines has increased demand for post-security dining options.
“Many carriers don’t provide any food on the airplane,” Fentress says. “So the people who are getting to the airport earlier to make sure they get through security are waiting, and they want something to eat. If there’s any kind of flight delay, they know they might be stuck in the airport or stuck up in the air for a while without any food.”
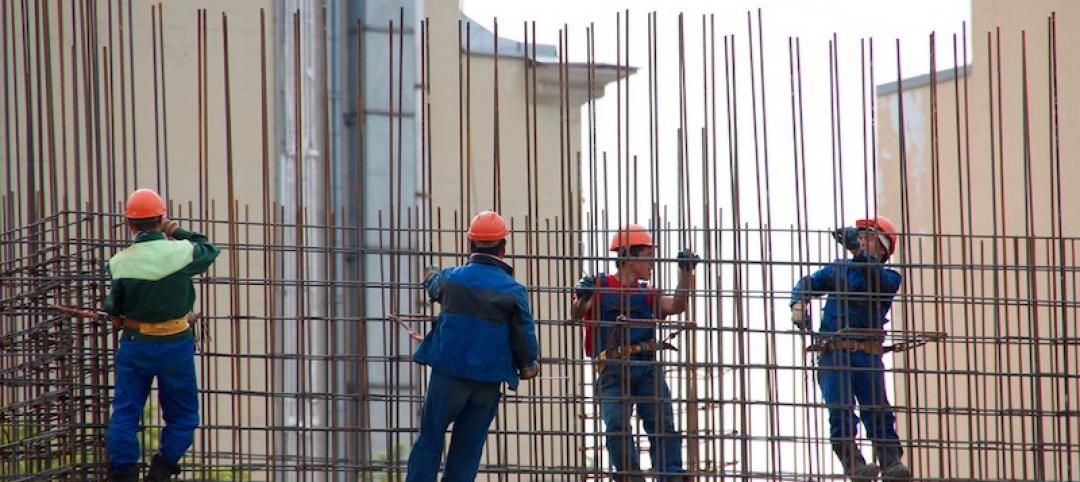
Airports are scrambling to respond with renovations and new terminals, even as they deal with TSA rules that can change in an instant. From CTX scanners—van-sized x-ray machines used to examine checked bags—to passenger scanners, the range of large equipment that terminals must accommodate just keeps morphing. Building Teams and their clients are adopting structural tactics that support change.
“We’re using more steel, which allows us to make longer distances between columns,” Fentress says. “The more long-span construction you can do, the more flexibility you have in the future.”
Top Air Terminal Sector Architecture Firms
| Rank | Company | 2013 Air Terminal Revenue Revenue |
| 1 | HOK | $47,074,837 |
| 2 | Gensler | 35,675,000 |
| 3 | Kohn Pedersen Fox Associates | 30,792,300 |
| 4 | Corgan | 26,376,420 |
| 5 | Fentress Architects | 26,333,785 |
| 6 | Stantec | 22,650,631 |
| 7 | RS&H | 22,050,000 |
| 8 | Skidmore, Owings & Merrill | 20,454,225 |
| 9 | PGAL | 17,120,000 |
| 10 | Heery International | 13,057,793 |
| 11 | HNTB Corp. | 10,900,639 |
| 12 | Leo A Daly | 9,490,737 |
| 13 | Gresham, Smith and Partners | 6,733,000 |
| 14 | SchenkelShultz Architecture | 6,179,000 |
| 15 | HKS | 4,087,622 |
| 16 | LS3P | 3,282,241 |
| 17 | Morris Architects | 2,795,000 |
| 18 | Clark Nexsen | 2,214,183 |
| 19 | Solomon Cordwell Buenz | 1,700,000 |
| 20 | CTA Architects Engineers | 1,187,913 |
| 21 | ZGF Architects | 929,658 |
| 22 | BRPH | 925,000 |
| 23 | Epstein | 762,000 |
| 24 | RTKL Associates | 677,000 |
| 25 | Integrus Architecture | 641,695 |
| 26 | Ware Malcomb | 196,500 |
| 27 | Rosser International | 158,668 |
| 28 | JRS Architect | 135,000 |
| 29 | Environetics | 112,443 |
| 30 | Parkhill, Smith & Cooper | 92,000 |
| 31 | Cuningham Group Architecture | 44,964 |
| 32 | Beyer Blinder Belle | 9,544 |
| 33 | Perkins+will | 6,836 |
| 34 | Ratio Architects | 5,368 |
Top Air Terminal Sector Engineering Firms
| Rank | Company | 2013 Air Terminal Revenue Revenue |
| 1 | Jacobs | $118,990,000 |
| 2 | URS Corp. | 83,069,612 |
| 3 | Burns & McDonnell | 48,010,000 |
| 4 | Parsons Brinckerhoff | 27,025,899 |
| 5 | Arup | 21,447,760 |
| 6 | Leidos | 16,810,000 |
| 7 | Ross & Baruzzini | 12,814,720 |
| 8 | AECOM Technology Corp. | 9,630,000 |
| 9 | STV | 5,260,000 |
| 10 | WSP Group | 3,640,000 |
| 11 | KPFF Consulting Engineers | 3,125,000 |
| 12 | Syska Hennessy Group | 2,933,760 |
| 13 | TLC Engineering for Architecture | 1,984,605 |
| 14 | TTG | 1,653,250 |
| 15 | Thornton Tomasetti | 1,620,411 |
| 16 | Walter P Moore and Associates | 1,596,212 |
| 17 | Sparling | 1,583,537 |
| 18 | Stanley Consultants | 1,526,482 |
| 19 | Aon Fire Protection Engineering Corp. | 1,500,000 |
| 20 | Graef | 1,267,799 |
| 21 | RMF Engineering | 1,200,000 |
| 22 | Coffman Engineers | 1,139,884 |
| 23 | Magnusson Klemencic Associates | 1,068,015 |
| 24 | RDK Engineers | 870,000 |
| 25 | Vanderweil Engineers | 856,900 |
| 26 | Wiss, Janney, Elstner Associates | 550,000 |
| 27 | Simpson Gumpertz & Heger | 550,000 |
| 28 | Martin/Martin | 494,691 |
| 29 | M-E Engineers | 400,000 |
| 30 | Newcomb & Boyd | 351,932 |
| 31 | Zak Companies | 351,488 |
| 32 | I. C. Thomasson Associates | 300,000 |
| 33 | Davis, Bowen & Friedel | 257,524 |
| 34 | Guernsey | 252,705 |
| 35 | Environmental Systems Design | 198,068 |
| 36 | CTLGroup | 180,000 |
| 37 | Joseph R. Loring & Associates | 175,000 |
| 38 | Heapy Engineering | 172,189 |
| 39 | Barge Waggoner Sumner & Cannon | 150,000 |
| 40 | GRW | 138,862 |
| 41 | Wallace Engineering | 131,000 |
| 42 | Dunham Associates | 90,000 |
| 43 | CJL Engineering | 81,400 |
| 44 | KJWW Engineering Consultants | 81,358 |
| 45 | P2S Engineering | 50,418 |
| 46 | Smith Seckman Reid | 44,419 |
| 47 | Bridgers & Paxton Consulting Engineers | 38,111 |
| 48 | Spectrum Engineers | 16,993 |
| 49 | Brinjac Engineering | 12,515 |
| 50 | French & Parrello Associates | 9,215 |
| 51 | AKF Group | 6,000 |
Top Air Terminal Sector Construction Firms
| Rank | Company | 2013 Air Terminal Revenue Revenue |
| 1 | Turner Construction | $487,680,000 |
| 2 | Hensel Phelps | 418,780,000 |
| 3 | PCL Construction | 328,069,635 |
| 4 | Walsh Group, The | 315,399,703 |
| 5 | Austin Commercial | 267,162,953 |
| 6 | Suffolk Construction | 170,270,605 |
| 7 | Balfour Beatty US | 154,058,403 |
| 8 | Clark Group | 131,741,104 |
| 9 | McCarthy Holdings | 127,000,000 |
| 10 | Manhattan Construction | 119,660,000 |
| 11 | Hunt Construction Group | 109,000,000 |
| 12 | URS Corp. | 83,069,612 |
| 13 | Hill International | 55,000,000 |
| 14 | Flintco | 54,400,000 |
| 15 | Walbridge | 46,000,000 |
| 16 | Skanska USA | 45,635,393 |
| 17 | Lend Lease | 35,107,000 |
| 18 | Weitz Company, The | 33,745,047 |
| 19 | HITT Contracting | 27,200,000 |
| 20 | Parsons Brinckerhoff | 27,025,899 |
| 21 | Brasfield & Gorrie | 25,926,312 |
| 22 | Gilbane | 22,031,250 |
| 23 | Tutor Perini Corp. | 19,320,308 |
| 24 | New South Construction | 18,923,000 |
| 25 | BlueScope Construction | 18,631,283 |
| 26 | O'Neil Industries/W.E. O'Neil | 18,433,037 |
| 27 | Holder Construction | 13,132,000 |
| 28 | Heery International | 13,057,793 |
| 29 | Yates Companies, The | 12,900,000 |
| 30 | Whiting-Turner Contracting Co., The | 11,991,159 |
| 31 | Beck Group, The | 11,096,174 |
| 32 | EMJ Corp. | 10,000,000 |
| 33 | James McHugh Construction | 9,527,392 |
| 34 | Robins & Morton | 6,370,178 |
| 35 | Messer Construction | 5,994,758 |
| 36 | W. M. Jordan Company | 5,812,917 |
| 37 | STV | 5,260,000 |
| 38 | Hill & Wilkinson | 4,766,000 |
| 39 | Consigli Construction | 3,278,099 |
| 40 | Kraus-Anderson Construction | 3,000,000 |
| 41 | Sundt Construction | 1,564,147 |
| 42 | JE Dunn Construction | 1,239,884 |
| 43 | Hoffman Construction | 1,000,000 |
| 44 | Hoar Construction | 4,000 |
Read BD+C's full 2014 Giants 300 Report
Related Stories
Reconstruction & Renovation | Mar 16, 2017
Pols are ready to spend $1T on rebuilding America’s infrastructure. But who will pick which projects benefit?
The accounting and consulting firm PwC offers the industrial sector a five-step approach to getting more involved in this process.
Airports | Feb 23, 2017
New Orleans Airport to add five additional gates and $110 million to current expansion
The project is being hailed as the city’s most transformative since the construction of the Superdome.
Projects | Jan 25, 2017
Trump prioritizes infrastructure projects, as rebuilding America is now a hot political potato
Both parties are talking about $1 trillion in spending over the next decade. How projects will be funded, though, remains unresolved.
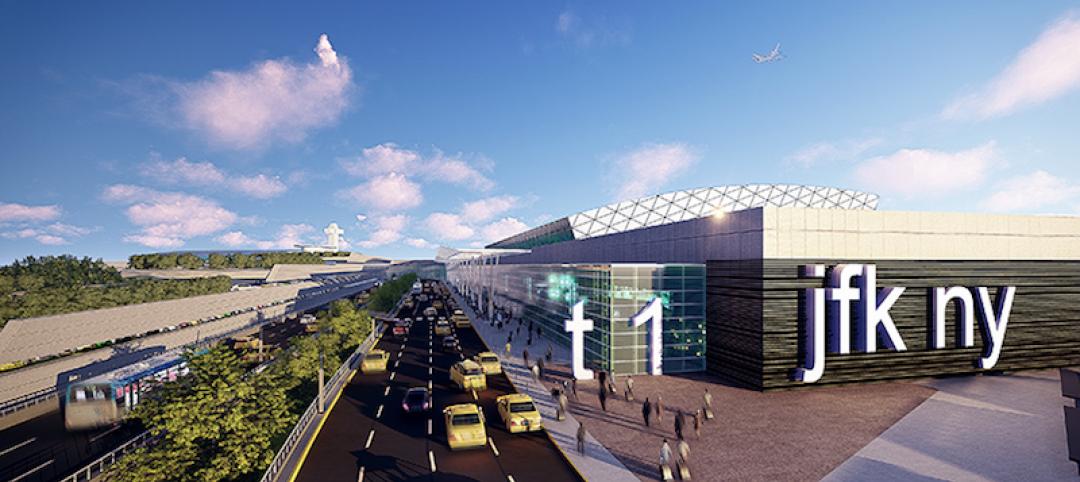
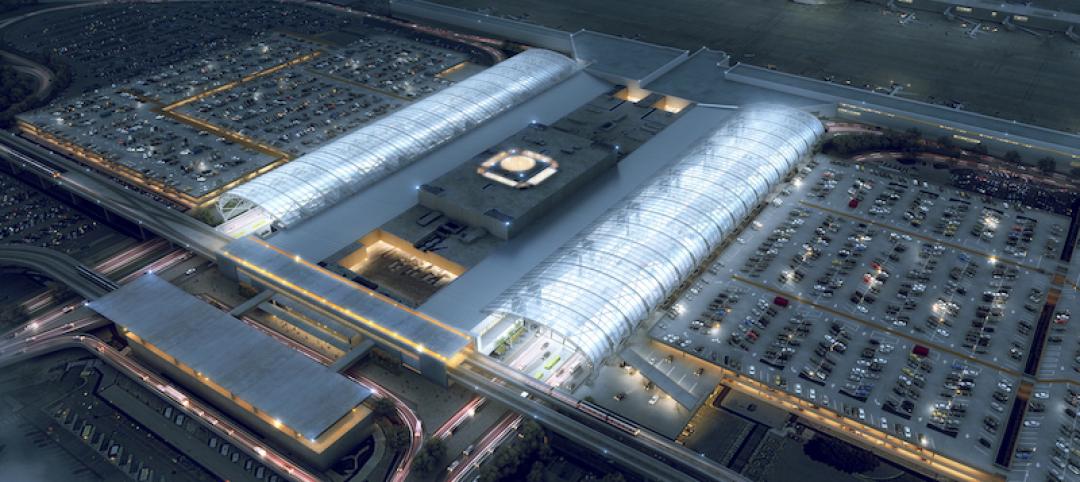
Airports | Jan 17, 2017
JFK Airport set for $10 billion renovation
In addition to the airport itself, the overhaul will also improve road and rail access to meet projected passenger growth.
Airports | Dec 6, 2016
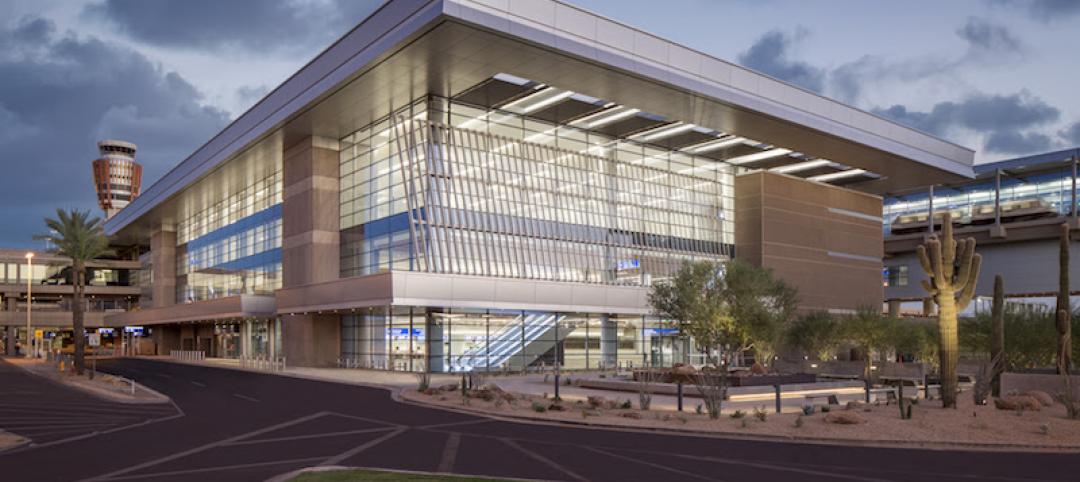
Phoenix Sky Harbor International Airport creates a destination inside Terminal 3
DWL Architects, SmithGroupJJR, and Corgan design passenger experience that connects to the surrounding city and Sonoran desert landscape.
Airports | Nov 1, 2016
FAA forecasts a modest dip in spending for airports over next five years
Latest report based on surveys of 3,340 existing and proposed public-use airports.

Airports | Aug 31, 2016
Aircraft manufacturing facility innovation from The Austin Company
Austin’s many innovations contributed to the success of our clients by enabling them to operate in more efficient environments, optimize the flexibility of their operations, and meet aggressive schedules.

| Jul 29, 2016
AIRPORT FACILITIES GIANTS: Airports binge on construction during busy year for travel
Terminal construction will grow by nearly $1 billion this year, and it will keep increasing. Airports are expanding and modernizing their facilities to keep passengers moving.
Airports | Jun 1, 2016
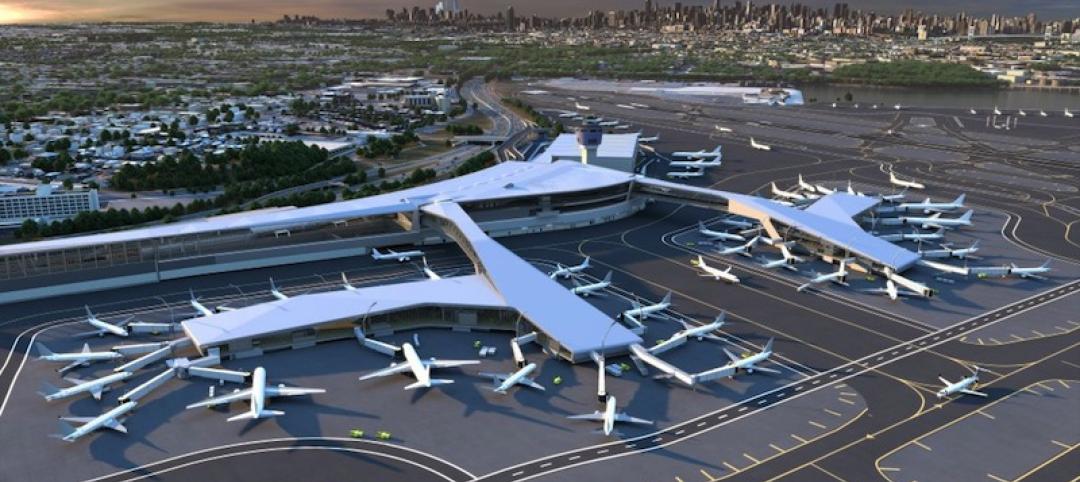
LaGuardia Airport’s massive redevelopment begins construction
The development consortium has secured financing for the $4 billion project, and signed an operating lease through 2050.
Airports | Apr 6, 2016
HOK leads joint venture to expand and modernize Hartsfield-Jackson Atlanta International Airport’s domestic passenger terminal
The domestic passenger terminal is just the tip of the spear, as the world’s most traveled airport is about to undergo 20 years and $6 billion worth of changes.


