


As has been the case a few times this year, the Architecture Billings Index (ABI) dipped in November.
As a leading economic indicator of construction activity, the ABI reflects the approximate nine to twelve month lead time between architecture billings and construction spending. The American Institute of Architects (AIA) reported the November ABI score was 49.3, down from the mark of 53.1 in the previous month. This score reflects a decrease in design services (any score above 50 indicates an increase in billings). The new projects inquiry index was 58.6, up just a nudge from a reading of 58.5 the previous month.
“Since architecture firms continue to report that they are bringing in new projects, this volatility in billings doesn’t seem to reflect any underlying weakness in the construction sector,” said AIA Chief Economist Kermit Baker, Hon. AIA, PhD. “Rather, it could reflect the uncertainty of moving ahead with projects given the continued tightness in construction financing and the growing labor shortage problem gripping the entire design and construction industries.”
Key November ABI highlights:
- Regional averages: South (55.4), West (54.5), Midwest (47.8), Northeast (46.2)
- Sector index breakdown: multi-family residential (53.8), institutional (51.4), commercial / industrial (55.1), mixed practice (54.9)
- Project inquiries index: 58.6
- Design contracts index: 53.5
The regional and sector categories are calculated as a 3-month moving average, whereas the national index, design contracts and inquiries are monthly numbers.
Related Stories
Market Data | Nov 27, 2017
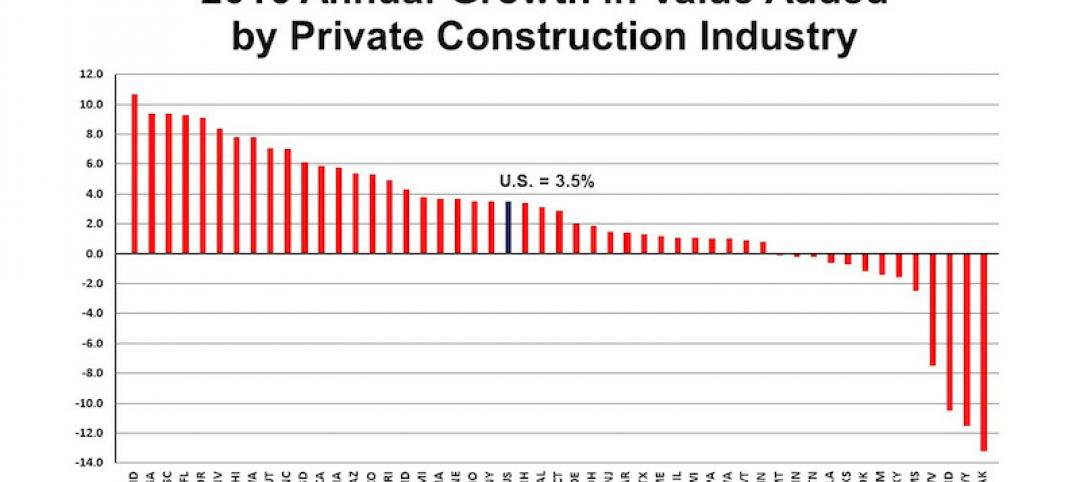
Construction's contribution to U.S. economy highest in seven years
Thirty-seven states benefited from the rise in construction activity in their state, while 13 states experienced a reduction in activity.
Market Data | Nov 15, 2017
Architecture Billings bounce back
Business conditions remain uneven across regions.
Market Data | Nov 14, 2017
U.S. construction starts had three consecutive quarters of positive growth in 2017
ConstructConnect’s quarterly report shows the most significant annual growth in the civil engineering and residential sectors.

Market Data | Nov 3, 2017
New construction starts in 2018 to increase 3% to $765 billion: Dodge report
Dodge Outlook Report predicts deceleration but still growth, reflecting a mixed pattern by project type.
Market Data | Nov 2, 2017
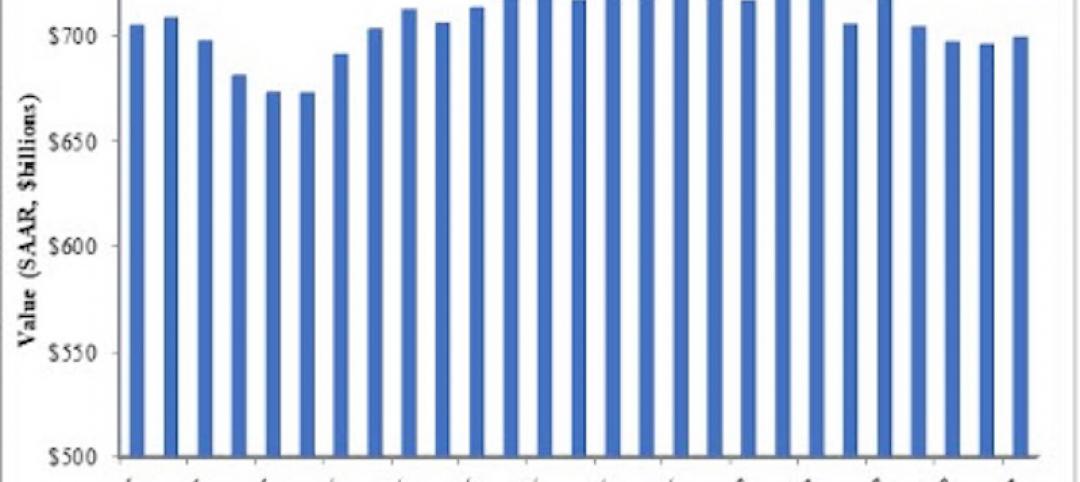
Construction spending up in September; Down on a YOY basis
Nonresidential construction spending is down 2.9% on a year-over-year basis.
Market Data | Oct 19, 2017
Architecture Billings Index backslides slightly
Business conditions easing in the West.

Industry Research | Oct 3, 2017
Nonresidential construction spending stabilizes in August
Spending on nonresidential construction services is still down on a YOY basis.

Market Data | Sep 21, 2017
Architecture Billings Index continues growth streak
Design services remain in high demand across all regions and in all major sectors.

Market Data | Sep 21, 2017
How brand research delivers competitive advantage
Brand research is a process that firms can use to measure their reputation and visibility in the marketplace.

Contractors | Sep 19, 2017
Commercial Construction Index finds high optimism in U.S. commercial construction industry
Hurricane recovery efforts expected to heighten concerns about labor scarcities in the south, where two-thirds of contractors already face worker shortages.


