

Construction employment decreased in 225, or 62%, out of 358 metro areas between June 2019 and last month despite widespread increases from May to June, according to an analysis of new government data that the Associated General Contractors of America released today. Association officials urged government officials to enact liability reform, boost infrastructure investments and extend tax credits to help the industry recover and rebuild.
“It’s troubling to see construction employment lagging year-ago levels in most locations, in spite of a strong rebound in May and June,” said Ken Simonson, the association’s chief economist. “Those gains were not enough to erase the huge losses in March and April. Many indicators since the employment data were collected in mid-June suggest construction employment will soon decline, or stagnate at best, in much of the country.”
Simonson noted that construction employment was stagnant in 39 metro areas and increased in only 94 areas (26%) over the past 12 months. Eighteen metros had all-time lows for June construction employment, while 28 areas had record highs for June, in data going back to 1990 for most areas.
New York City lost the most construction jobs over 12 months (-38,200 jobs, -24%) despite having the largest gain from May to June. Brockton-Bridgewater-Easton, Mass. had the largest percentage decline: -37% (-2,200 jobs). Austin-Round Rock, Texas added the most construction jobs from June 2019 to June 2020: 4,100 jobs (6%). Walla Walla, Wash. had the highest percentage increase: 27% (300 jobs).
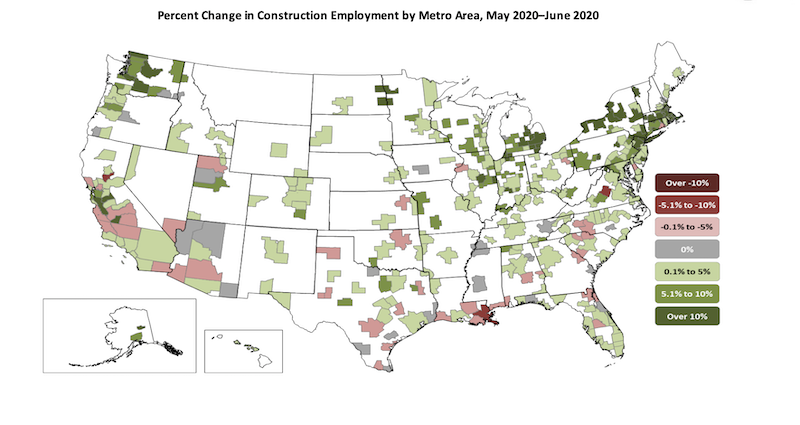
From May to June—a month when construction employment typically increases in most metro areas, 291 metros added construction employees; 42 areas had a decrease; and employment was unchanged in 25 areas. New York City added the most construction jobs between May and June: 22,100 or 22%. The largest percentage increase occurred in Monroe, Mich.: 31% (500 jobs). New Orleans-Metairie La. lost the most jobs during the month: -1,500 jobs (-6%). The largest percentage loss was in Yuba City, Calif.: -10% (-300 jobs).
Association officials noted that Senate Republican leaders released a new coronavirus recovery measure earlier this week that includes provisions that can help construction firms rebuild their payrolls. These include liability reforms so construction firms that are protecting workers from the coronavirus will not be subject to needless litigation. The proposal also includes improvement to the Paycheck Protection Program and an expansion of the Employee Retention Tax Credit the association supports.
“While the measure also addresses unemployment insurance and workforce development, it fails to include the kind of infrastructure funding needed to rebuild our economy” said Stephen E. Sandherr, the association’s chief executive officer. “That new funding is needed to address state transportation funding shortfalls, fix aging public facilities and help retrofit structures to protect students and others from the coronavirus.”
View the metro employment 1-month data, rankings, top 10, map and 12-month data, rankings, top 10, and map.
Related Stories

Senior Living Design | May 9, 2017
Designing for a future of limited mobility
There is an accessibility challenge facing the U.S. An estimated 1 in 5 people will be aged 65 or older by 2040.

Industry Research | May 4, 2017
How your AEC firm can go from the shortlist to winning new business
Here are four key lessons to help you close more business.

Engineers | May 3, 2017
At first buoyed by Trump election, U.S. engineers now less optimistic about markets, new survey shows
The first quarter 2017 (Q1/17) of ACEC’s Engineering Business Index (EBI) dipped slightly (0.5 points) to 66.0.

Market Data | May 2, 2017
Nonresidential Spending loses steam after strong start to year
Spending in the segment totaled $708.6 billion on a seasonally adjusted, annualized basis.

Market Data | May 1, 2017
Nonresidential Fixed Investment surges despite sluggish economic in first quarter
Real gross domestic product (GDP) expanded 0.7 percent on a seasonally adjusted annualized rate during the first three months of the year.

Industry Research | Apr 28, 2017
A/E Industry lacks planning, but still spending large on hiring
The average 200-person A/E Firm is spending $200,000 on hiring, and not budgeting at all.

Market Data | Apr 19, 2017
Architecture Billings Index continues to strengthen
Balanced growth results in billings gains in all regions.

Market Data | Apr 13, 2017
2016’s top 10 states for commercial development
Three new states creep into the top 10 while first and second place remain unchanged.

Market Data | Apr 6, 2017
Architecture marketing: 5 tools to measure success
We’ve identified five architecture marketing tools that will help your firm evaluate if it’s on the track to more leads, higher growth, and broader brand visibility.

Market Data | Apr 3, 2017
Public nonresidential construction spending rebounds; overall spending unchanged in February
The segment totaled $701.9 billion on a seasonally adjusted annualized rate for the month, marking the seventh consecutive month in which nonresidential spending sat above the $700 billion threshold.


