

With an average cost per square foot of $16.11, Stamford, Conn., is the most costly U.S. market for commercial real estate, according to a new study by the Building Owners and Managers Association International. New York and San Francisco are also among the nation's priciest markets.
Using the results from the BOMA 2013 Experience Exchange Report, the group compiled a list of the most and least expensive commercial real estate city-markets in the United States. The annual report aggregates rental income and operating expense figures from the previous year; in 2012, data was gathered from more than 5,300 buildings across 250 markets and 115 cities in the United States and Canada.
Five most expensive city-markets – total operating expenses:
1. Stamford, Conn. $16.11 per square foot (psf)
2. New York $11.80 psf
3. Grand Rapids, Mich. $11.16 psf
4. Newark, N.J. $10.34 psf
5. San Francisco $9.66 psf
Five least expensive city-markets – total operating expenses:
1. Stockton, Calif. $3.57 psf
2. Fresno, Calif. $3.61 psf
3. Huntsville, Ala. $4.31 psf
4. Virginia Beach, Va. $4.64 psf
5. Albuquerque, N.M. $4.80 psf
Total operating expenses incorporate all expenses incurred to operate office buildings, including utilities, repairs and maintenance, roads and grounds, cleaning, administration, and security. Fixed expenses include real estate taxes, property taxes and insurance.
There was a 3.9 percent overall decrease in total operating expenses from 2011 to 2012, underscoring an industry focus on maximizing building efficiency in the face of dwindling income streams. For example, New York, which topped the list of most expensive markets for operating expenses last year, saw a decrease of $0.66 per square foot.
Five most expensive city-markets – total rental income:
1. Washington, D.C. $44.30 psf
2. New York $39.00 psf
3. San Mateo, Calif. $34.96 psf
4. San Francisco $34.49 psf
5. Santa Monica, Calif. $34.04 psf
Five least expensive city-markets – total rental income:
1. Macon, Ga. $8.16 psf
2. Shreveport, La. $11.18 psf
3. Columbus, Ohio $12.09 psf
4. Huntsville, Ala. $12.81 psf
5. Little Rock, Ark. $12.81 psf
Total rental income includes rental income from office, retail and other space, such as storage areas.
While average rental income has dropped somewhat, decreasing 2.9 percent from 2011 to 2012, building owners and managers are compensating for these income losses with greater reductions in expenses.
The Experience Exchange Report is the premier income and expense data benchmarking tool for the commercial real estate industry. The EER allows users to conduct multi-year analysis of single markets and select multiple cities to generate state and regional reports. It also offers the capability to search by building size, height, age and more for broader analysis. Subscriptions are available at www.bomaeer.com.
About BOMA International
The Building Owners and Managers Association (BOMA) International is a federation of 93 BOMA U.S. associations, BOMA Canada and its 11 regional associations and 13 BOMA international affiliates. Founded in 1907, BOMA represents the owners and managers of all commercial property types, including nearly 10 billion square feet of U.S. office space that supports 3.7 million jobs and contributes $205 billion to the U.S. GDP. Its mission is to advance the interests of the entire commercial real estate industry through advocacy, education, research, standards and information. Find BOMA online at www.boma.org.
Related Stories

K-12 Schools | Feb 13, 2024
K-12 school design trends for 2024: health, wellness, net zero energy
K-12 school sector experts are seeing “healthiness” for schools expand beyond air quality or the ease of cleaning interior surfaces. In this post-Covid era, “healthy” and “wellness” are intersecting expectations that, for many school districts, encompass the physical and mental wellbeing of students and teachers, greater access to outdoor spaces for play and learning, and the school’s connection to its community as a hub and resource.

Codes | Feb 9, 2024
Illinois releases stretch energy code for building construction
Illinois is the latest jurisdiction to release a stretch energy code that provides standards for communities to mandate more efficient building construction. St. Louis, Mo., and a few states, including California, Colorado, and Massachusetts, currently have stretch codes in place.

Market Data | Feb 7, 2024
New download: BD+C's February 2024 Market Intelligence Report
Building Design+Construction's monthly Market Intelligence Report offers a snapshot of the health of the U.S. building construction industry, including the commercial, multifamily, institutional, and industrial building sectors. This report tracks the latest metrics related to construction spending, demand for design services, contractor backlogs, and material price trends.

Retail Centers | Feb 4, 2024
‘Safe bathroom’ technology prevents fatal drug overdoses in public restrooms
‘Safe bathroom’ technology developed by a Massachusetts electrician has been proven to prevent fatal drug overdoses in public restrooms across the country. The systems use ultrasonic and infrared motion sensors connected to timers that detect slight body movements. When a system doesn’t sense motion within a set time period, it raises an alarm alerting emergency medical teams.

Standards | Feb 1, 2024
Prioritizing water quality with the WELL Building Standard
In this edition of Building WELLness, DC WELL Accredited Professionals Hannah Arthur and Alex Kircher highlight an important item of the WELL Building Standard: water.

Industry Research | Jan 23, 2024
Leading economists forecast 4% growth in construction spending for nonresidential buildings in 2024
Spending on nonresidential buildings will see a modest 4% increase in 2024, after increasing by more than 20% last year according to The American Institute of Architects’ latest Consensus Construction Forecast. The pace will slow to just over 1% growth in 2025, a marked difference from the strong performance in 2023.

Construction Costs | Jan 22, 2024
Construction material prices continue to normalize despite ongoing challenges
Gordian’s most recent Quarterly Construction Cost Insights Report for Q4 2023 describes an industry still attempting to recover from the impact of COVID. This was complicated by inflation, weather, and geopolitical factors that resulted in widespread pricing adjustments throughout the construction materials industries.

Hotel Facilities | Jan 22, 2024
U.S. hotel construction is booming, with a record-high 5,964 projects in the pipeline
The hotel construction pipeline hit record project counts at Q4, with the addition of 260 projects and 21,287 rooms over last quarter, according to Lodging Econometrics.

Modular Building | Jan 19, 2024
Virginia is first state to adopt ICC/MBI offsite construction standards
Virginia recently became the first state to adopt International Code Council/Modular Building Institute off-site construction standards.
Mixed-Use | Jan 19, 2024
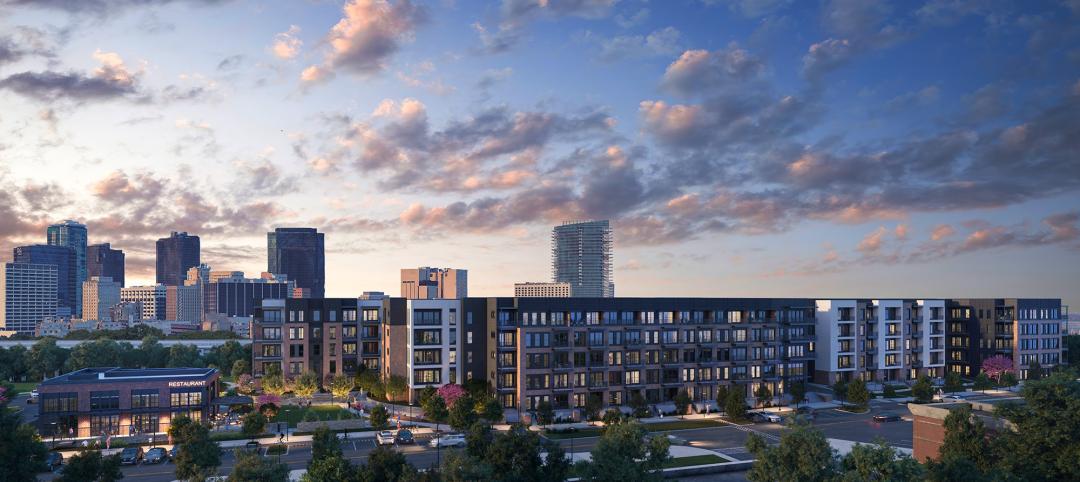
Trademark secures financing to develop Fort Worth multifamily community
National real estate developer, investor, and operator, Trademark Property Company, has closed on the land and secured the financing for The Vickery, a multifamily-led mixed-use community located on five acres at W. Vickery Boulevard and Hemphill Street overlooking Downtown Fort Worth.


