Transwestern’s first quarter national office report confirmed the general opinion that the U.S. office market remains strong, with overall vacancy holding steady at 9.8%. National average asking rents nudged higher during the quarter to $26.63 per square foot, reflecting a 4.1% annual growth rate that exceeded the five-year compound annual average (CAGR) of 3.4%.
Of the 49 U.S. markets tracked by Transwestern, 45 reported positive rent growth, with 24 of those recording rates above 3.0%. The leaders in rent growth included Minneapolis; San Francisco; San Jose, California; Nashville, Tennessee; Raleigh/Durham, North Carolina; Tampa, Florida; Pittsburgh; California’s Inland Empire; Manhattan; and Charlotte, North Carolina.
“The U.S. economy grew 3.2% in the first quarter, the highest first-quarter growth in four years,” said Ryan Tharp, Research Director in Dallas. “That said, we are closely watching how factors such as U.S. trade conditions might impact the domestic economy in the remainder of 2019.”
Overall office leasing activity in the U.S. has slowed since 2016 but still ended the first quarter 1.5 million square feet higher than a year ago. Net absorption fell to 10.9 million square feet, with sublet space recording negative growth of 1.6 million square feet.
Construction activity jumped 9.7% during the past year, the highest level in the current cycle, but rising land and construction costs and labor challenges continue to limit new building deliveries and stave off systemic overbuilding that undermined some previous cycles.
“Solid fundamentals and adequate debt and equity capital bode well for continued, healthy performance in the office sector and cap rates remain at historic lows,” Tharp said. “We expect asking rents to settle at an annual rate of growth between 3.0% and 3.5% by the end of the year.”
Download the full National Office Market Report at: http://twurls.com/1q19-us-office
Related Stories
Contractors | Apr 19, 2023
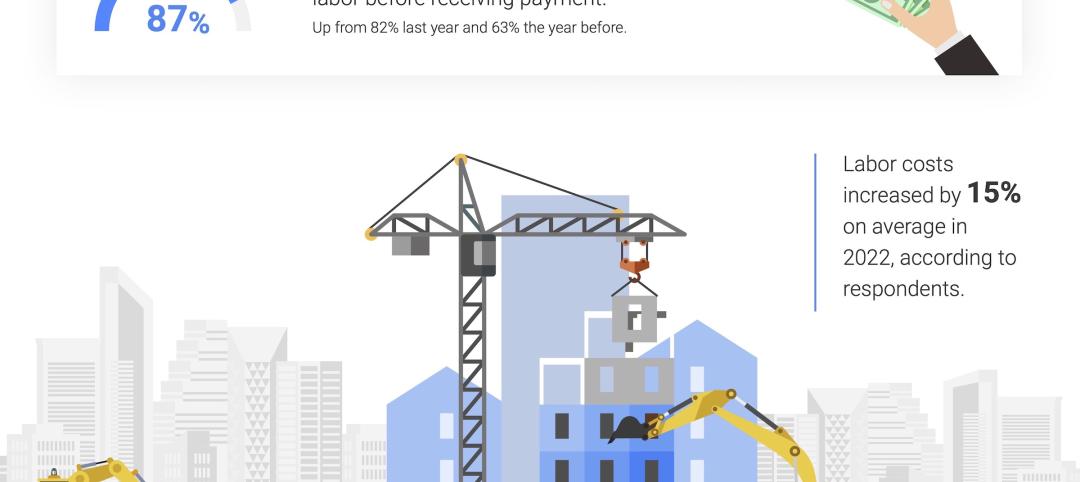
Rising labor, material prices cost subcontractors $97 billion in unplanned expenses
Subcontractors continue to bear the brunt of rising input costs for materials and labor, according to a survey of nearly 900 commercial construction professionals.
Data Centers | Apr 14, 2023
JLL's data center outlook: Cloud computing, AI driving exponential growth for data center industry
According to JLL’s new Global Data Center Outlook, the mass adoption of cloud computing and artificial intelligence (AI) is driving exponential growth for the data center industry, with hyperscale and edge computing leading investor demand.
Healthcare Facilities | Apr 13, 2023
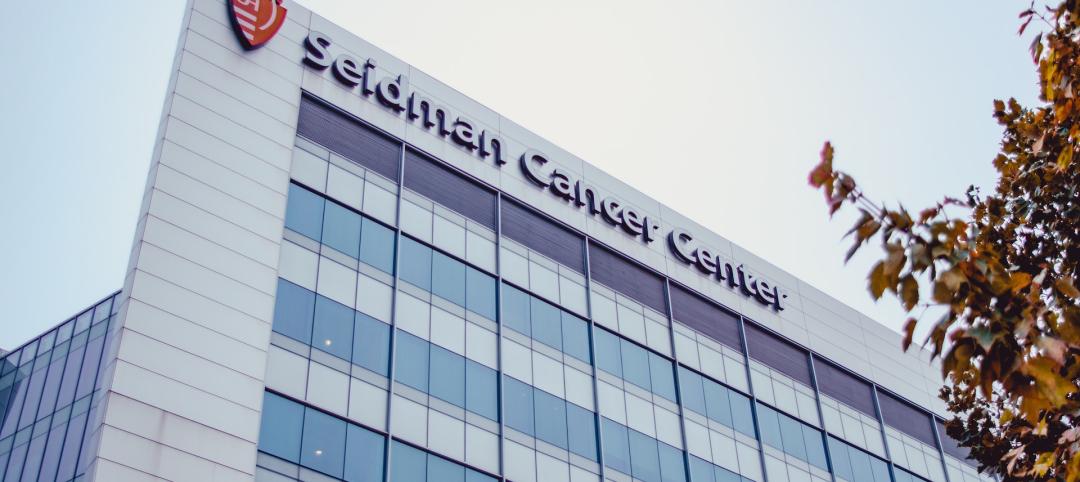
Healthcare construction costs for 2023
Data from Gordian breaks down the average cost per square foot for a three-story hospital across 10 U.S. cities.
Higher Education | Apr 13, 2023
Higher education construction costs for 2023
Fresh data from Gordian breaks down the average cost per square foot for a two-story college classroom building across 10 U.S. cities.
Market Data | Apr 13, 2023
Construction input prices down year-over-year for first time since August 2020
Construction input prices increased 0.2% in March, according to an Associated Builders and Contractors analysis of U.S. Bureau of Labor Statistics Producer Price Index data released today. Nonresidential construction input prices rose 0.4% for the month.
Market Data | Apr 11, 2023
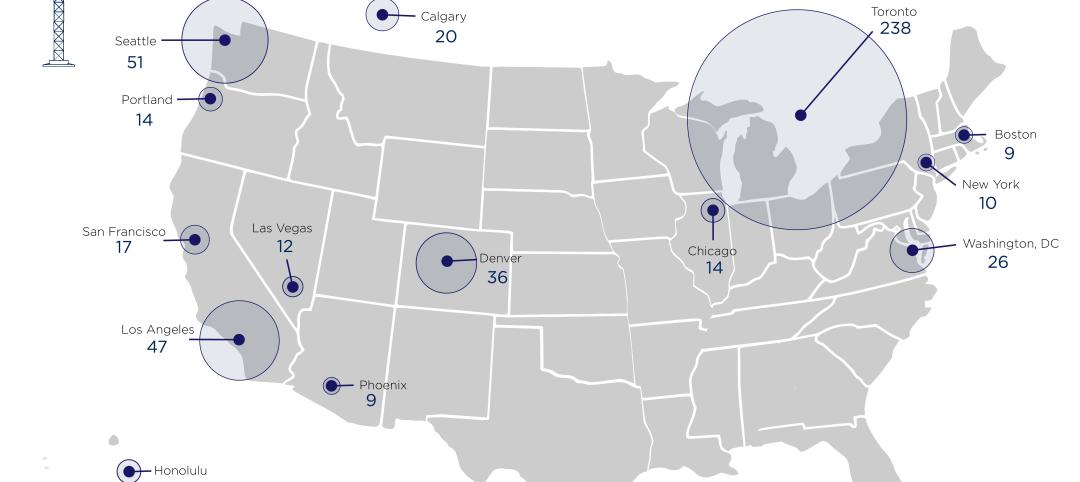
Construction crane count reaches all-time high in Q1 2023
Toronto, Seattle, Los Angeles, and Denver top the list of U.S/Canadian cities with the greatest number of fixed cranes on construction sites, according to Rider Levett Bucknall's RLB Crane Index for North America for Q1 2023.
Contractors | Apr 11, 2023
The average U.S. contractor has 8.7 months worth of construction work in the pipeline, as of March 2023
Associated Builders and Contractors reported that its Construction Backlog Indicator declined to 8.7 months in March, according to an ABC member survey conducted March 20 to April 3. The reading is 0.4 months higher than in March 2022.
Market Data | Apr 6, 2023
JLL’s 2023 Construction Outlook foresees growth tempered by cost increases
The easing of supply chain snags for some product categories, and the dispensing with global COVID measures, have returned the North American construction sector to a sense of normal. However, that return is proving to be complicated, with the construction industry remaining exceptionally busy at a time when labor and materials cost inflation continues to put pricing pressure on projects, leading to caution in anticipation of a possible downturn. That’s the prognosis of JLL’s just-released 2023 U.S. and Canada Construction Outlook.
Market Data | Apr 4, 2023
Nonresidential construction spending up 0.4% in February 2023
National nonresidential construction spending increased 0.4% in February, according to an Associated Builders and Contractors analysis of data published by the U.S. Census Bureau. On a seasonally adjusted annualized basis, nonresidential spending totaled $982.2 billion for the month, up 16.8% from the previous year.
Multifamily Housing | Mar 24, 2023
Average size of new apartments dropped sharply in 2022
The average size of new apartments in 2022 dropped sharply in 2022, as tracked by RentCafe. Across the U.S., the average new apartment size was 887 sf, down 30 sf from 2021, which was the largest year-over-year decrease.


