


NAIOP, the Commercial Real Estate Development Association, recently released its annual study “Economic Impacts of Commercial Real Estate” in which it details the development, construction, and ongoing operations of new commercial real estate in the U.S.
The study shows office, industrial, warehouse, and retail real estate development supported 6.25 million American jobs and contributed $861 billion to U.S. GDP in 2016. Between 2011 and October 2016, construction spending increased 48.7% and was a key factor in the economy’s growth in 2016. For the year ending in October 2016, total construction spending was up 3.4%.
Office and Warehouse spending increased by 28.7% and 12.7% respectively from 2015. Retail spending decreased 7 percent from gains of 8.2% in 2015. Industrial spending decreased significantly for the second straight year, down 29.9% from 2015.
Of the top 10 states by construction value (office, industrial, warehouse, and retail), only three (New York, Texas, and Florida) remained in the same position as 2015. New York was once again first on the list with $24.8 billion in direct spending and $46.05 billion in total output. Texas wasn’t far behind with $18.5 billion in direct spending and $44.3 billion in total output. Florida once again took the fifth position on the list.

To view the full report, click here.
Related Stories

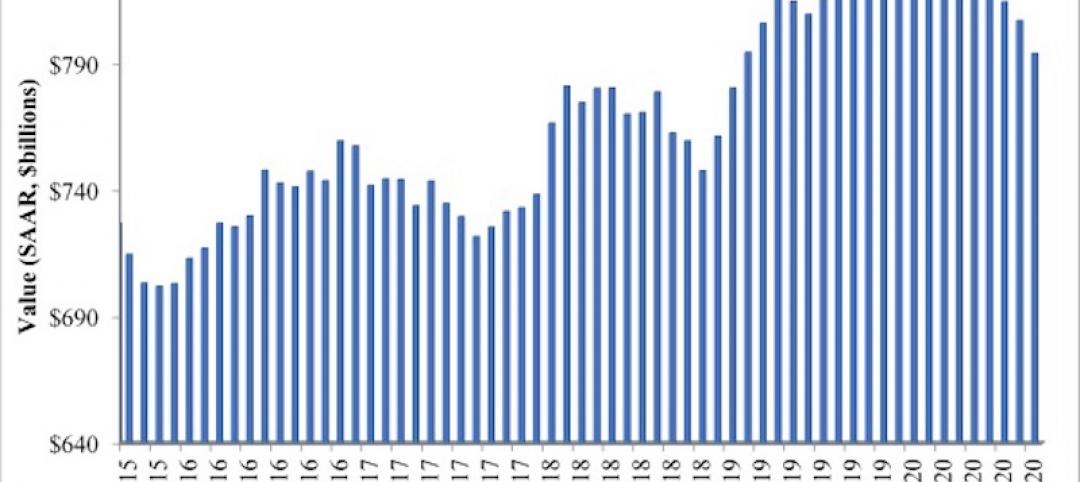
Market Data | Dec 2, 2020
Nonresidential construction spending remains flat in October
Residential construction expands as many commercial projects languish.

Market Data | Nov 30, 2020
New FEMA study projects implementing I-Codes could save $600 billion by 2060
International Code Council and FLASH celebrate the most comprehensive study conducted around hazard-resilient building codes to-date.

Market Data | Nov 23, 2020
Construction employment is down in three-fourths of states since February
This news comes even after 36 states added construction jobs in October.

Market Data | Nov 18, 2020
Architecture billings remained stalled in October
The pace of decline during October remained at about the same level as in September.

Market Data | Nov 17, 2020
Architects face data, culture gaps in fighting climate change
New study outlines how building product manufacturers can best support architects in climate action.

Market Data | Nov 10, 2020
Construction association ready to work with president-elect Biden to prepare significant new infrastructure and recovery measures
Incoming president and congress should focus on enacting measures to rebuild infrastructure and revive the economy.

Market Data | Nov 9, 2020
Construction sector adds 84,000 workers in October
A growing number of project cancellations risks undermining future industry job gains.

Market Data | Nov 4, 2020
Drop in nonresidential construction offsets most residential spending gains as growing number of contractors report cancelled projects
Association officials warn that demand for nonresidential construction will slide further without new federal relief measures.
Market Data | Nov 2, 2020
Nonresidential construction spending declines further in September
Among the sixteen nonresidential subcategories, thirteen were down on a monthly basis.

Market Data | Nov 2, 2020
A white paper assesses seniors’ access to livable communities
The Joint Center for Housing Studies and AARP’s Public Policy Institute connect livability with income, race, and housing costs.


