


NAIOP, the Commercial Real Estate Development Association, recently released its annual study “Economic Impacts of Commercial Real Estate” in which it details the development, construction, and ongoing operations of new commercial real estate in the U.S.
The study shows office, industrial, warehouse, and retail real estate development supported 6.25 million American jobs and contributed $861 billion to U.S. GDP in 2016. Between 2011 and October 2016, construction spending increased 48.7% and was a key factor in the economy’s growth in 2016. For the year ending in October 2016, total construction spending was up 3.4%.
Office and Warehouse spending increased by 28.7% and 12.7% respectively from 2015. Retail spending decreased 7 percent from gains of 8.2% in 2015. Industrial spending decreased significantly for the second straight year, down 29.9% from 2015.
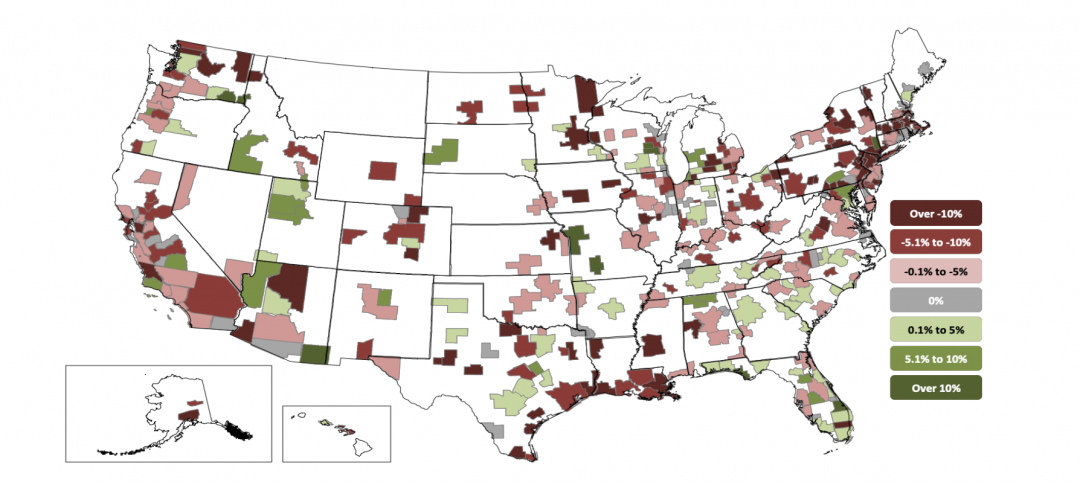
Of the top 10 states by construction value (office, industrial, warehouse, and retail), only three (New York, Texas, and Florida) remained in the same position as 2015. New York was once again first on the list with $24.8 billion in direct spending and $46.05 billion in total output. Texas wasn’t far behind with $18.5 billion in direct spending and $44.3 billion in total output. Florida once again took the fifth position on the list.

To view the full report, click here.
Related Stories
Market Data | Nov 2, 2020
More contractors report canceled projects than starts, survey finds
Construction employment declined in most metros in latest 12 months.

Multifamily Housing | Oct 30, 2020
The Weekly show: Multifamily security tips, the state of construction industry research, and AGC's market update
BD+C editors speak with experts from AGC, Charles Pankow Foundation, and Silva Consultants on the October 29 episode of "The Weekly." The episode is available for viewing on demand.

Hotel Facilities | Oct 27, 2020
Hotel construction pipeline dips 7% in Q3 2020
Hospitality developers continue to closely monitor the impact the coronavirus will have on travel demand, according to Lodging Econometrics.

Market Data | Oct 22, 2020
Multifamily’s long-term outlook rebounds to pre-covid levels in Q3
Slump was a short one for multifamily market as 3rd quarter proposal activity soars.

Market Data | Oct 21, 2020
Architectural billings slowdown moderated in September
AIA’s ABI score for September was 47.0 compared to 40.0 in August.
Market Data | Oct 21, 2020
Only eight states top February peak construction employment despite gains in 32 states last month
California and Vermont post worst losses since February as Virginia and South Dakota add the most.

Market Data | Oct 20, 2020
AIA releases updated contracts for multi-family residential and prototype residential projects
New resources provide insights into mitigating and managing risk on complex residential design and construction projects.

Market Data | Oct 20, 2020
Construction officials call on Trump and Biden to establish a nationwide vaccine distribution plan to avoid confusion and delays
Officials say nationwide plan should set clear distribution priorities.

Market Data | Oct 19, 2020
5 must reads for the AEC industry today: October 19, 2020
Lower cost metros outperform pricey gateway markets and E-commerce fuels industrial's unstoppable engine.

Market Data | Oct 19, 2020
Lower-cost metros continue to outperform pricey gateway markets, Yardi Matrix reports
But year-over-year multifamily trendline remained negative at -0.3%, unchanged from July.


