


Rents in most American cities continue to rise slightly each month, but are not duplicating the rapid escalation rates exhibited in 2021. But given ongoing gains, Yardi® Matrix has revised its end-of-year projections upwards for most markets in a new special report.
Average month-over-month asking rents increased by 1.1 percent in May compared to the one percent month-over-month increase in April. However, year-over-year asking rents decelerated, from 16 percent in April to 14 percent in May.
“While we are seeing the usual seasonal increase leading into the summer months, 2022 does not look like a repeat of 2021 even though rent growth remains elevated,” state Matrix analysts.
Asking rents fell in only six markets: the gateway markets of Queens and Brooklyn; small Southern markets Macon, Ga., and Jackson, Miss.; and tropical Honolulu and the Southwest Florida Coast.
Conversely, 84 markets experienced greater than one percent month-over-month increase, and seven markets saw month-over-month growth that topped two percent: Charleston, Knoxville, the Bay Area-South Bay, Miami, the Urban Twin Cities, Wilmington, N.C., and Portland, Maine.
Most markets received an increase to their end-of-year projections in the newly released Matrix report. The biggest increases were concentrated in markets that continue to outperform expectations, with Scranton-Wilkes-Barre, Wilmington, South Bend and Spokane all seeing a more than five percent increase for year-end 2022.
Learn more about the expectations for rents for the remainder of 2022.
Yardi Matrix offers the industry’s most comprehensive market intelligence tool for investment professionals, equity investors, lenders and property managers who underwrite and manage investments in commercial real estate. Yardi Matrix covers multifamily, student housing, industrial, office and self storage property types. Email matrix@yardi.com, call 480-663-1149 or visit yardimatrix.com to learn more.
Related Stories
Industry Research | Jun 26, 2017
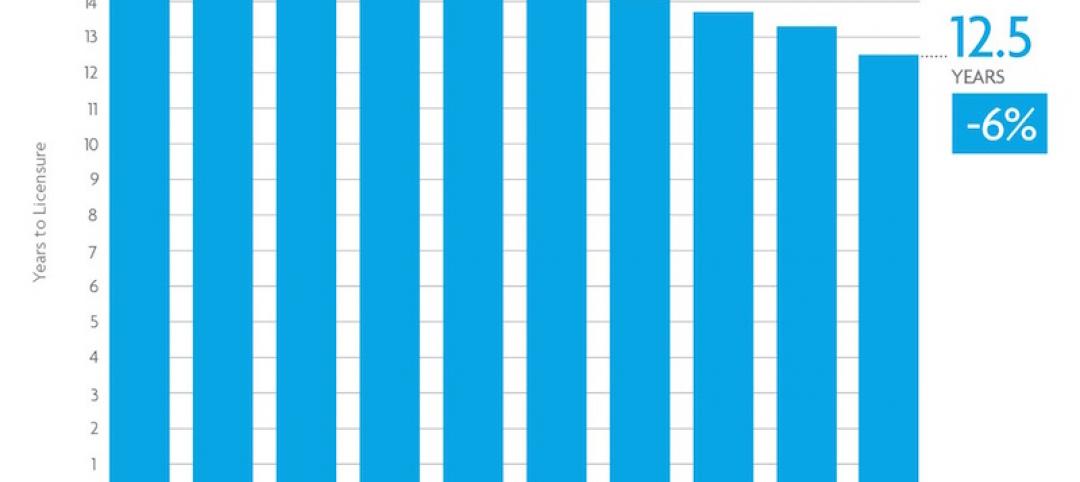
Time to earn an architecture license continues to drop
This trend is driven by candidates completing the experience and examination programs concurrently and more quickly.
Industry Research | Jun 22, 2017
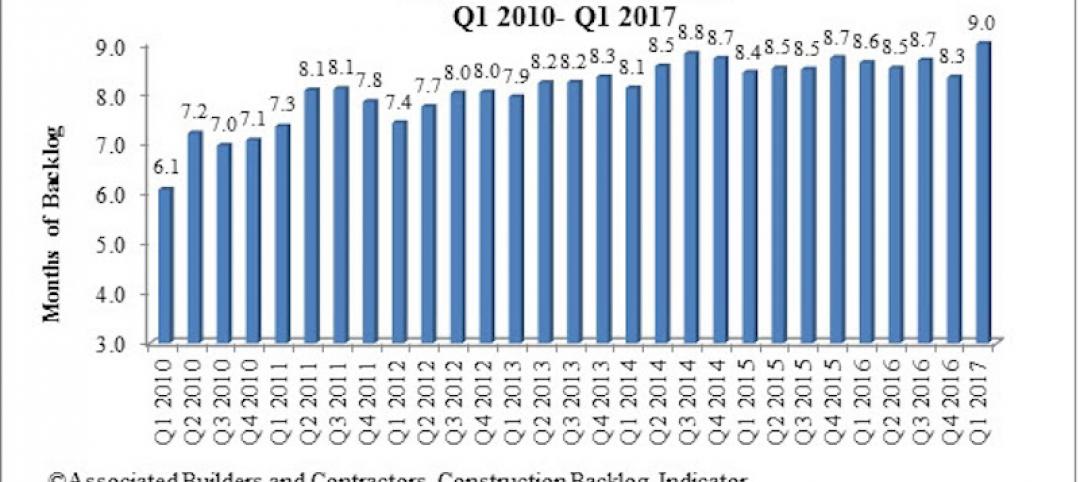
ABC's Construction Backlog Indicator rebounds in 2017
The first quarter showed gains in all categories.
Market Data | Jun 21, 2017
Design billings maintain solid footing, strong momentum reflected in project inquiries/design contracts
Balanced growth results in billings gains in all sectors.

Market Data | Jun 16, 2017
Residential construction was strong, but not enough, in 2016
The Joint Center for Housing Studies’ latest report expects minorities and millennials to account for the lion’s share of household formations through 2035.

Industry Research | Jun 15, 2017
Commercial Construction Index indicates high revenue and employment expectations for 2017
USG Corporation (USG) and U.S. Chamber of Commerce release survey results gauging confidence among industry leaders.

Market Data | Jun 2, 2017
Nonresidential construction spending falls in 13 of 16 segments in April
Nonresidential construction spending fell 1.7% in April 2017, totaling $696.3 billion on a seasonally adjusted, annualized basis, according to analysis of U.S. Census Bureau data released today by Associated Builders and Contractors.

Industry Research | May 25, 2017
Project labor agreement mandates inflate cost of construction 13%
Ohio schools built under government-mandated project labor agreements (PLAs) cost 13.12 percent more than schools that were bid and constructed through fair and open competition.

Market Data | May 24, 2017
Design billings increasing entering height of construction season
All regions report positive business conditions.

Market Data | May 24, 2017
The top franchise companies in the construction pipeline
3 franchise companies comprise 65% of all rooms in the Total Pipeline.

Industry Research | May 24, 2017
These buildings paid the highest property taxes in 2016
Office buildings dominate the list, but a residential community climbed as high as number two on the list.


