

Nationally, the average cost to build out an office is $196.49/sf. But after taking into account the average landlord-provided tenant-improvement allowance of $43.61/sf, the out-of-pocket cost for tenants is $152.88/sf, according to JLL’s new U.S. Fit Out Guide.
The report combines fitout costs and tenant improvement allowances to paint a comprehensive picture of what companies can expect to pay out of pocket for an office buildout across the nation. It also details the most- and least-expensive markets for fitouts.
Coming out on top as the most expensive market to build out an office is Silicon Valley, Calif., with an out-of-pocket cost of $199.22. The most affordable market: Washington, D.C., at $103.88.
“It’s no surprise that the Northwest continues to be the most expensive region for office builds,” says Mason Mularoni, Senior Research Analyst, JLL Project and Development Services. Southern cities claimed six out of the 10 most affordable markets.
Due to the range of landlord-provided tenant improvement packages, some cities that made the top lists were pretty unexpected.
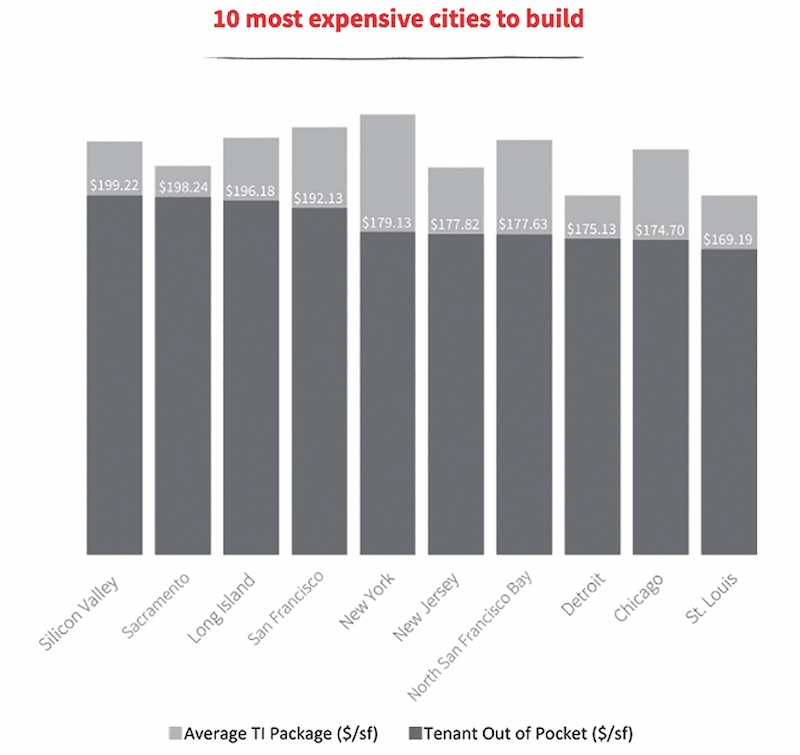 Silicon Valley, Calif., is the most expensive market for office fitout projects, with an average out-of-pocket cost of $199.22/sf, according to JLL.
Washington, D.C.: most affordable. Often topping most-expensive lists, the District of Columbia is officially the most inexpensive market to build out an office space. As the federal government, contractors, and law firms continue to consolidate, slightly below-average buildout costs are offset by record-high concession packages from landlords who are desperate to get tenants into the exploding mass of available space.
Detroit: eighth most expensive. Once on the brink of financial collapse, the Motor City is being reinvigorated by an eager tech community. Startups, investors, and outside firms are attracted to the Motor City’s resolve to bounce back.
But Detroit isn’t in the clear just yet. Due to above-average buildout costs and minimal TI packages, the city swings in as one of the top out-of-pocket cost markets.
Los Angeles: sixth most affordable market to build out an office. New leasing activity has been nourished by the convergence of media, technology, and entertainment. The tech sector in particular has shown a preference for creative buildouts. LA’s enormous TI packages are tied with Washington, D.C., for largest in the nation, offering an affordable option in the notoriously expensive state.
Long Island, N.Y.: third most expensive, beating out traditional frontrunner New York City. When it comes to building costs alone, New York City tops the list. But substantial TI packages in the city allow Long Island to slide ahead in out-of-pocket costs, holding its own against the expensive Northern California cities.
Seattle: seventh most affordable. Although the Northwest region tops the most expensive list, Seattle is the exception to the rule. Technology continues to be the primary factor of the city, and significant growth is occurring from local companies as well as from tenants migrating from the Bay Area.
The second-largest TI package average across the nation enables Seattle to hold down seventh place in most-affordable-city honors.
Related Stories

MFPRO+ News | Dec 11, 2023
U.S. poorly prepared to house growing number of older adults
The U.S. is ill-prepared to provide adequate housing for the growing ranks of older people, according to a report from Harvard University’s Joint Center for Housing Studies. Over the next decade, the U.S. population older than 75 will increase by 45%, growing from 17 million to nearly 25 million, with many expected to struggle financially.
Industry Research | Dec 9, 2023
Two new reports provide guidance for choosing healthier building products
The authors, Perkins&Will and the Healthy Building Network, home in on drywall, flooring, and insulation.The authors, Perkins&Will and the Healthy Building Network, home in on drywall, flooring, and insulation.
Student Housing | Dec 5, 2023
October had fastest start ever for student housing preleasing
The student housing market for the upcoming 2024-2025 leasing season has started sooner and faster than ever.

Industry Research | Nov 28, 2023
Migration trends find top 10 states Americans are moving to
In the StorageCafe analysis of the latest migration trends, each U.S. state was looked at to see the moving patterns of people in the last few years. These are the top 10 states that people are moving to.

Market Data | Nov 27, 2023
Number of employees returning to the office varies significantly by city
While the return-to-the-office trend is felt across the country, the percentage of employees moving back to their offices varies significantly according to geography, according to Eptura’s Q3 Workplace Index.

MFPRO+ News | Nov 21, 2023
Renters value amenities that support a mobile, connected lifestyle
Multifamily renters prioritize features and amenities that reflect a mobile, connected lifestyle, according to the National Multifamily Housing Council (NMHC) and Grace Hill 2024 Renter Preferences Survey.

Industry Research | Nov 17, 2023
Air conditioning amenity sees largest growth in Pacific Northwest region
The 2024 Renter Preferences Survey Report sheds light on the demographics, lifestyle, connectivity needs, and more for the renters of today. At the top of this list—the feature that respondents are “interested in” or “won't rent without”—is air conditioning.
Multifamily Housing | Nov 9, 2023
Multifamily project completions forecast to slow starting 2026
Yardi Matrix has released its Q4 2023 Multifamily Supply Forecast, emphasizing a short-term spike and plateau of new construction.

MFPRO+ Special Reports | Oct 27, 2023
Download the 2023 Multifamily Annual Report
Welcome to Building Design+Construction and Multifamily Pro+’s first Multifamily Annual Report. This 76-page special report is our first-ever “state of the state” update on the $110 billion multifamily housing construction sector.

Market Data | Oct 23, 2023
New data finds that the majority of renters are cost-burdened
The most recent data derived from the 2022 Census American Community Survey reveals that the proportion of American renters facing housing cost burdens has reached its highest point since 2012, undoing the progress made in the ten years leading up to the pandemic.


