

Staying ahead of cost trends can feel like an uphill battle. Market volatility, geographical variations and the lag between project initiation to build introduces unpredictability in the total cost of construction projects. Working in uncertainty can lead to budget overruns, delays and decreased profitability, making it challenging to keep up. But what if there was a solution that could turn these challenges into opportunities for success? To ensure success in any project, you need the ability to anticipate changes and make informed decisions.
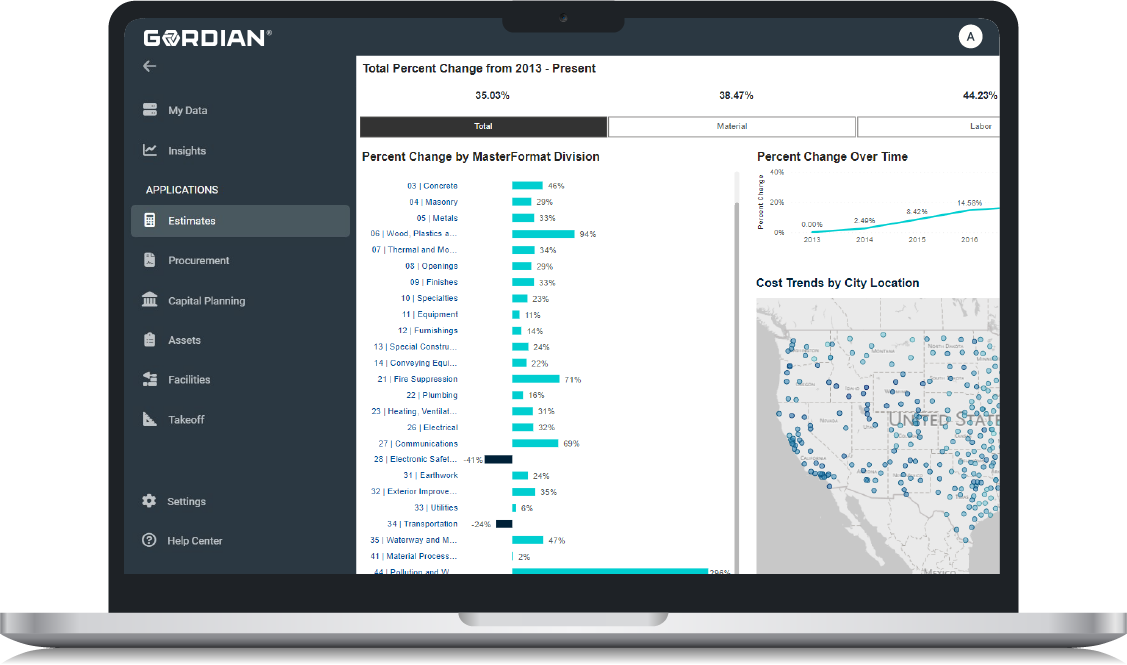
Turn data into actionable intelligence with Gordian’s new Data Insights – Cost Trends Dashboard, powered by RSMeans™ Data. Unveiled at their 2024 RSMeans™ Data Webinar, Gordian’s latest tool empowers organizations to gain more real time insight into shifting cost trends across construction categories and geographies – all within a single, visually digestible dashboard.
Gordian’s Data Insights – Cost Trends gives you a comprehensive view into historical construction cost trends, providing visibility into current cost movements. This allows you to strategically evaluate and adjust your estimates and budgets based on how prices have fluctuated in past, similar market conditions. By using a systematic, automated method of accessing cost trends, you have up-to-date insights at your fingertips, saving time, eliminating guesswork and enhancing decision-making.
What Can You Expect From Data Insights – Cost Trends?
- Go from guesswork to an objective approach
Leveraging past experiences for project budgeting and estimating is beneficial, but manual methods are error-prone and inefficient. A systematic, objective approach allows you to identify hidden patterns, understand trends over time and adjust estimates to align with current market conditions.
- Granular insights across construction categories
Leveraging RSMeans™ Data, the Dashboard provides an aggregated, historical view of cost data in an intuitive design, giving you the ability to compare multiple levels of detail based on empirical figures. From overall cost trends to drilling down by cost components, including labor, material, equipment or at the task division level.
Historical cost trends across geographies
Whether you are looking for local market insights or researching unfamiliar geographical markets, the Dashboard provides location-specific cost trends for nearly 1,000 North American markets so you can compare costs and benchmark across various locations. Uncover hidden patterns in historical cost data, providing a clear picture of trends over time, or pinpoint current market conditions in nearby areas to determine where you can find cost savings on materials and project costs.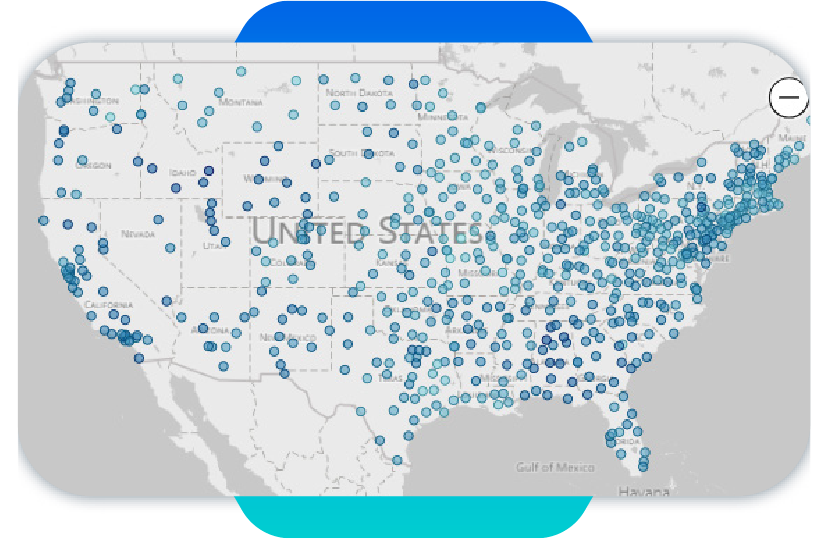
Access local market insights or research unfamiliar geographical markets.
- Communicate data in a way everyone can understand
Complex data insights are made easily digestible through clear visualizations in an intuitive interface. Empower non-technical users to explore and discover actionable market intelligences to anticipate cost changes, adjust budgets and make informed decisions when prioritizing and planning construction projects.
Get Ready to Empower Your Organization With Actionable Intelligence
Gordian’s Data Insights – Cost Trends Dashboard provides more than just data. It offers a flexible, intuitive and interactive experience, enabling more effective planning, budgeting and estimating in construction projects. It’s the tool that empowers estimators, facility owners, facility managers and contractors alike to take control of projects.
Staying ahead of cost trends is no longer a luxury, it’s a necessity. Learn how you can start making informed, proactive decisions to ensure your organizations success with Gordian’s new Data Insights – Cost Trends Dashboard.
Company Information:
Name: Gordian
Website: rsmeans.com
Contact Information: Sales Inquiries – 888-675-3601
Related Stories
| Jun 13, 2017
Accelerate Live! talk: A case for Big Data in construction, Graham Cranston, Simpson Gumpertz & Heger
Graham Cranston shares SGH’s efforts to take hold of its project data using mathematical optimization techniques and information-rich interactive visual graphics.
| May 24, 2017
Accelerate Live! talk: Applying machine learning to building design, Daniel Davis, WeWork
Daniel Davis offers a glimpse into the world at WeWork, and how his team is rethinking workplace design with the help of machine learning tools.
| May 24, 2017
Accelerate Live! talk: Learning from Silicon Valley - Using SaaS to automate AEC, Sean Parham, Aditazz
Sean Parham shares how Aditazz is shaking up the traditional design and construction approaches by applying lessons from the tech world.
| May 24, 2017
Accelerate Live! talk: The data-driven future for AEC, Nathan Miller, Proving Ground
In this 15-minute talk at BD+C’s Accelerate Live! (May 11, 2017, Chicago), Nathan Miller presents his vision of a data-driven future for the business of design.
Big Data | May 24, 2017
Data literacy: Your data-driven advantage starts with your people
All too often, the narrative of what it takes to be ‘data-driven’ focuses on methods for collecting, synthesizing, and visualizing data.
Sustainable Design and Construction | Apr 5, 2017
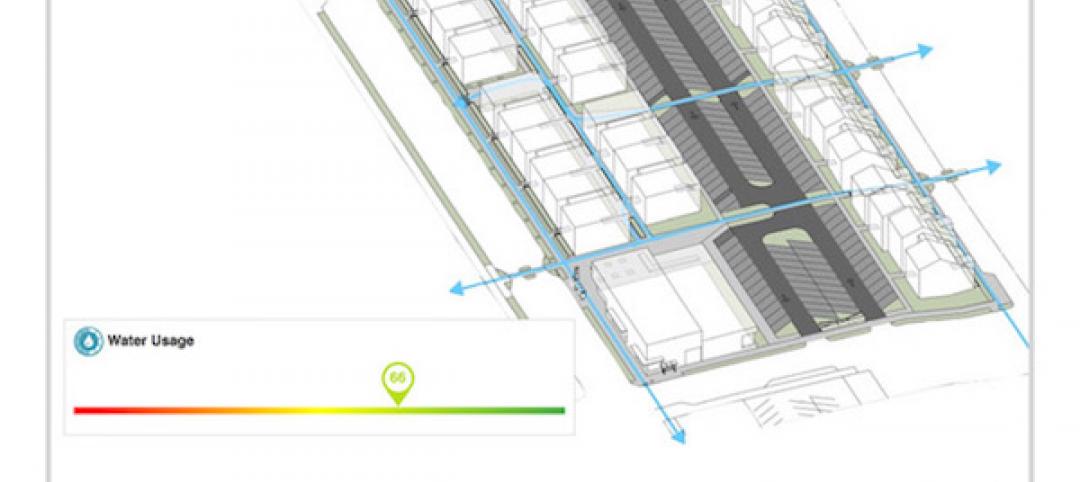
A new app brings precision to designing a building for higher performance
PlanIt Impact's sustainability scoring is based on myriad government and research data.

AEC Tech | Dec 18, 2016
Customized future weather data now available for online purchase
Simulation tool, developed by Arup and Argos Analytics, is offered to help owners and AEC firms devise resilience strategies for buildings.

Big Data | May 27, 2016
Analytics alone won't save money for healthcare facility owners
Advanced technology provides insight into the actions necessary to cut costs, but it's the people, processes, and implementation that make a difference with analytics, writes CBRE's Paul Oswald.

Big Data | May 9, 2016
City planners find value in data from Strava, a cyclist tracking app
More than 75 metro areas around the world examine cyclists’ routes and speeds that the app has recorded.

AEC Tech | May 9, 2016
Is the nation’s grand tech boom really an innovation funk?
Despite popular belief, the country is not in a great age of technological and digital innovation, at least when compared to the last great innovation era (1870-1970).


