


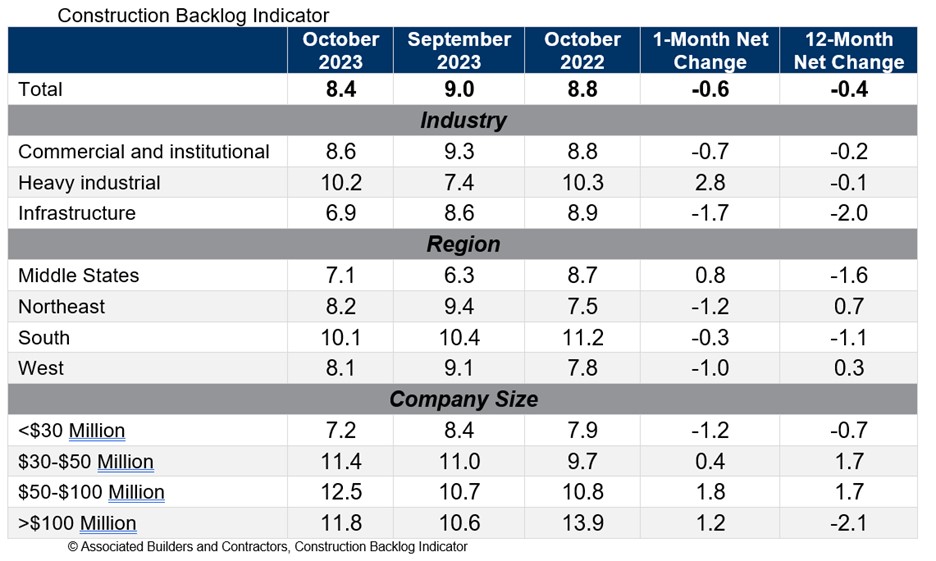
Associated Builders and Contractors reported that its Construction Backlog Indicator declined to 8.4 months in October from 9.0 months in September, according to an ABC member survey conducted from Oct. 19 to Nov. 2. The reading is down 0.4 months from October 2022.
Backlog now stands at its lowest level since the first quarter of 2022. Declines were concentrated among the smallest contractors, those with less than $30 million in annual revenues. All three other revenue categories experienced an increase in backlog in October.
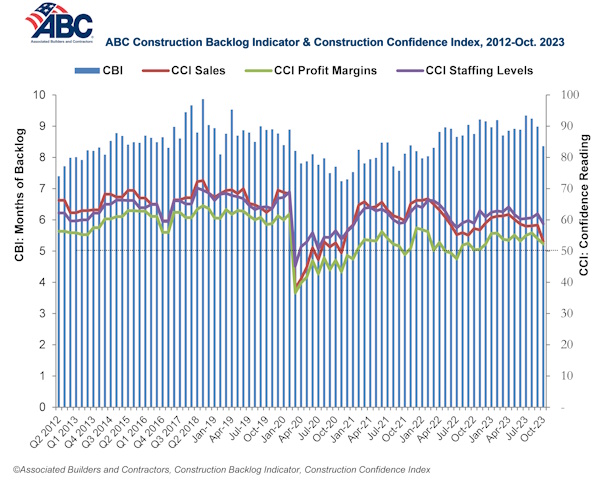
ABC’s Construction Confidence Index readings for sales, staffing levels and profit margins fell in October. All three readings remain above the threshold of 50, indicating expectations for growth over the next six months.
“While larger contractors continue to disproportionately benefit from a bevy of megaprojects around the nation, many smaller contractors are feeling the sting of weaker economic fundamentals in struggling commercial real estate segments,” said ABC Chief Economist Anirban Basu. “Smaller contractors are often the ones most dependent on developer-driven activity. With developers facing both higher borrowing costs and greater difficulty lining up project financing, backlog among some contractors is beginning to dissipate.
“This is precisely what ABC economists predicted,” said Basu. “The vast majority of contractors could boast healthy backlog, especially those working in the manufacturing/industrial, infrastructure, data center and health care segments. But those tied to the office, shopping center and multifamily markets are likely experiencing difficulty lining up work. This helps explain declines in the readings for ABC’s Construction Confidence Index in all three dimensions: sales, employment and margins. Each of these readings, however, remains above 50, suggesting that, while industry growth is softening, it has yet to enter contractionary territory.”
Related Stories

Hotel Facilities | Jan 13, 2016
Hotel construction should remain strong through 2017
More than 100,000 rooms could be delivered this year alone.

Market Data | Jan 6, 2016
Census Bureau revises 10 years’ worth of construction spending figures
The largest revisions came in the last two years and were largely upward.

Market Data | Jan 5, 2016
Majority of AEC firms saw growth in 2015, remain optimistic for 2016: BD+C survey
By all indications, 2015 was another solid year for U.S. architecture, engineering, and construction firms.
Market Data | Jan 5, 2016
Nonresidential construction spending falters in November
Only 4 of 16 subsectors showed gains

Market Data | Dec 15, 2015
AIA: Architecture Billings Index hits another bump
Business conditions show continued strength in South and West regions.

Market Data | Dec 7, 2015
2016 forecast: Continued growth expected for the construction industry
ABC forecasts growth in nonresidential construction spending of 7.4% in 2016 along with growth in employment and backlog.


