


Analysts at Lodging Econometrics (LE) report that in the third quarter of 2021 the total U.S. construction pipeline stands at 4,837 projects/592,259 rooms, down 8% by projects and 10% by rooms year-over-year (YOY). While project numbers have seen a slight increase over second quarter totals, overall, the construction pipeline remains largely muted due to a reduced inflow of new projects in the pipeline as compared to “pre-COVID levels,” and significant hotel openings during the first half of the year which exited the pipeline. The prolonged effects of the pandemic, above average inflation, rising interest rates, and material shortages and price increases have been and will continue to be key factors in decision-making for developers through the end of the year.
However, many developers really do have a long term positive outlook on hotel development as projects in the early planning stage are up considerably, with 1,978 projects/239,831 rooms, a 27% increase by projects and 25% by rooms YOY and reaching a cyclical peak this quarter. Conversely, projects scheduled to start construction in the next 12 months are down 14% by projects and 15% by rooms YOY, with 1,824 projects/210,189 rooms at the end of the third quarter. Projects under construction were also down in Q3, ending the quarter at 1,035 projects/142,239 rooms. This is largely due to projects that have completed construction and have opened. Presently, inflation and the increasing cost and sourcing of labor and materials, combined with supply chain shortages and delays, continue to be a major variable for hotel development. In response, developers are reworking budgets, revising plans to minimize costs, and adjusting construction start and project opening dates to endure the challenges of a recovering industry.
Though the path to full recovery may be longer than originally expected, two main steppingstones aiding in the recovery have been the recent rise in hotel stock values as well as increases in lending activity. Rebounding hotel stocks and better-than-expected hotel and travel demand throughout the summer season has renewed developer sentiment.
Renovation and conversion pipeline activity remains steady at the end of Q3 ‘21, with conversion projects hitting a cyclical peak, and ending the quarter at 752 projects/79,024 rooms. Combined, renovation and conversion activity accounts for 1,253 projects and 176,305 rooms.
Through the third quarter of 2021, the U.S. opened 665 new hotels with 85,306 rooms with another 221 projects/23,026 rooms anticipated to open by the end of the year, totaling 886 projects/108,332 rooms for 2021. Our research analysts expect an increase in new hotel openings in 2022, with 970 projects accounting for 110,123 rooms forecast to open in 2022 and another 961 projects/111,249 rooms anticipated to open in 2023.
Related Stories
Market Data | Apr 4, 2018
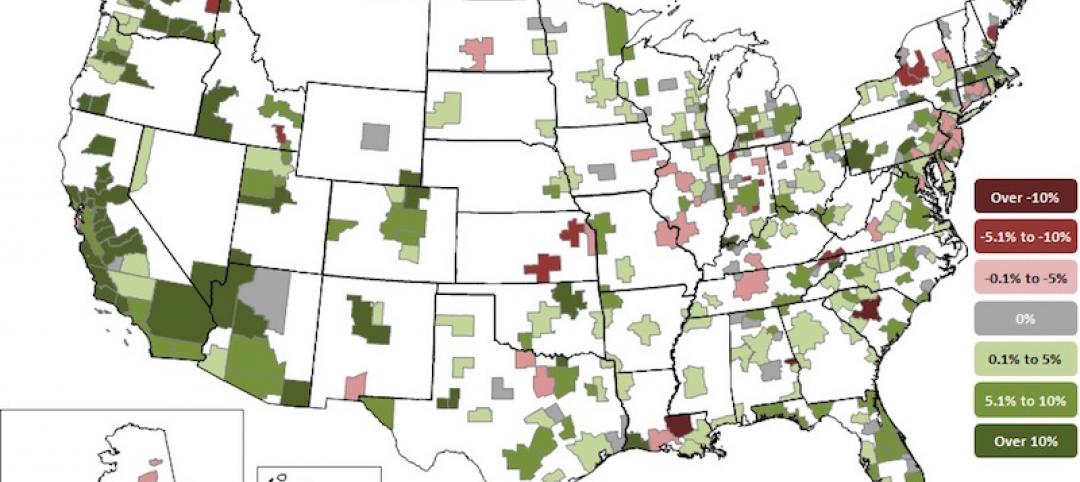
Construction employment increases in 257 metro areas between February 2017 & 2018 as construction firms continue to expand amid strong demand
Riverside-San Bernardino-Ontario, Calif. and Merced, Calif. experience largest year-over-year gains; Baton Rouge, La. and Auburn-Opelika, Ala. have biggest annual declines in construction employment.
Market Data | Apr 2, 2018
Construction spending in February inches up from January
Association officials urge federal, state and local officials to work quickly to put recently enacted funding increases to work to improve aging and over-burdened infrastructure, offset public-sector spending drops.

Market Data | Mar 29, 2018
AIA and the University of Minnesota partner to develop Guides for Equitable Practice
The Guides for Equitable Practice will be developed and implemented in three phase.

Market Data | Mar 22, 2018
Architecture billings continue to hold positive in 2018
Billings particularly strong at firms in the West and Midwest regions.

Market Data | Mar 21, 2018
Construction employment increases in 248 metro areas as new metal tariffs threaten future sector job gains
Riverside-San Bernardino-Ontario, Calif., and Merced, Calif., experience largest year-over-year gains; Baton Rouge, La., and Auburn-Opelika, Ala., have biggest annual declines in construction employment.
Market Data | Mar 19, 2018
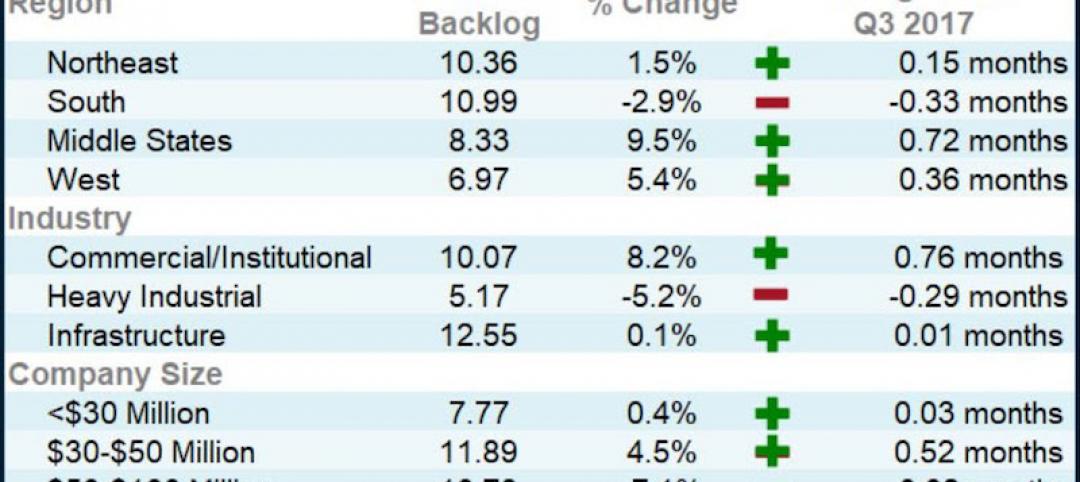
ABC's Construction Backlog Indicator hits a new high: 2018 poised to be a very strong year for construction spending
CBI is up by 1.36 months, or 16.3%, on a year-over-year basis.

Market Data | Mar 15, 2018
ABC: Construction materials prices continue to expand briskly in February
Compared to February 2017, prices are up 5.2%.

Market Data | Mar 14, 2018
AGC: Tariff increases threaten to make many project unaffordable
Construction costs escalated in February, driven by price increases for a wide range of building materials, including steel and aluminum.
Market Data | Mar 12, 2018
Construction employers add 61,000 jobs in February and 254,000 over the year
Hourly earnings rise 3.3% as sector strives to draw in new workers.

Steel Buildings | Mar 9, 2018
New steel and aluminum tariffs will hurt construction firms by raising materials costs; potential trade war will dampen demand, says AGC of America
Independent studies suggest the construction industry could lose nearly 30,000 jobs as a result of administration's new tariffs as many firms will be forced to absorb increased costs.


