


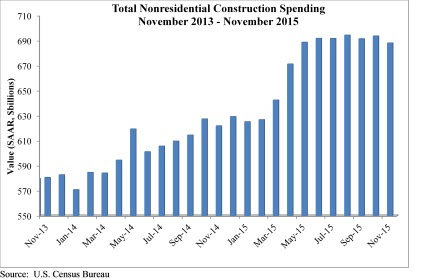
Spending for nonresidential construction, which had been on the uptick for most of 2015, stumbled in the latter months.
Related Stories

Contractors | May 24, 2023
The average U.S. contractor has 8.9 months worth of construction work in the pipeline, as of April 2023
Contractor backlogs climbed slightly in April, from a seven-month low the previous month, according to Associated Builders and Contractors.

Multifamily Housing | May 23, 2023
One out of three office buildings in largest U.S. cities are suitable for residential conversion
Roughly one in three office buildings in the largest U.S. cities are well suited to be converted to multifamily residential properties, according to a study by global real estate firm Avison Young. Some 6,206 buildings across 10 U.S. cities present viable opportunities for conversion to residential use.

Industry Research | May 22, 2023
2023 High Growth Study shares tips for finding success in uncertain times
Lee Frederiksen, Managing Partner, Hinge, reveals key takeaways from the firm's recent High Growth study.

Multifamily Housing | May 8, 2023
The average multifamily rent was $1,709 in April 2023, up for the second straight month
Despite economic headwinds, the multifamily housing market continues to demonstrate resilience, according to a new Yardi Matrix report.

Market Data | May 2, 2023
Nonresidential construction spending up 0.7% in March 2023 versus previous month
National nonresidential construction spending increased by 0.7% in March, according to an Associated Builders and Contractors analysis of data published today by the U.S. Census Bureau. On a seasonally adjusted annualized basis, nonresidential spending totaled $997.1 billion for the month.

Hotel Facilities | May 2, 2023
U.S. hotel construction up 9% in the first quarter of 2023, led by Marriott and Hilton
In the latest United States Construction Pipeline Trend Report from Lodging Econometrics (LE), analysts report that construction pipeline projects in the U.S. continue to increase, standing at 5,545 projects/658,207 rooms at the close of Q1 2023. Up 9% by both projects and rooms year-over-year (YOY); project totals at Q1 ‘23 are just 338 projects, or 5.7%, behind the all-time high of 5,883 projects recorded in Q2 2008.

Market Data | May 1, 2023
AEC firm proposal activity rebounds in the first quarter of 2023: PSMJ report
Proposal activity for architecture, engineering and construction (A/E/C) firms increased significantly in the 1st Quarter of 2023, according to PSMJ’s Quarterly Market Forecast (QMF) survey. The predictive measure of the industry’s health rebounded to a net plus/minus index (NPMI) of 32.8 in the first three months of the year.

Industry Research | Apr 25, 2023
The commercial real estate sector shouldn’t panic (yet) about recent bank failures
A new Cushman & Wakefield report depicts a “well capitalized” banking industry that is responding assertively to isolated weaknesses, but is also tightening its lending.

Architects | Apr 21, 2023
Architecture billings improve slightly in March
Architecture firms reported a modest increase in March billings. This positive news was tempered by a slight decrease in new design contracts according to a new report released today from The American Institute of Architects (AIA). March was the first time since last September in which billings improved.

Contractors | Apr 19, 2023
Rising labor, material prices cost subcontractors $97 billion in unplanned expenses
Subcontractors continue to bear the brunt of rising input costs for materials and labor, according to a survey of nearly 900 commercial construction professionals.


