

Between 2011 and 2016, the U.S. population age 50 years or older grew by 10.5 million to more than 112 million. While the vast majority of older Americans owns homes, homeownership rates are lower than the past, and a significant number of adults drawing closer to retirement might not have the financial wherewithal to afford to either buy or rent where they want to live.
That is the primary concern expressed by the latest Joint Center for Housing Studies’ report “Housing America’s Older Adults 2018,” which releases today.
The study relies mostly on data up to 2016, and reiterates a common theme in many of the Joint Center’s past papers: that America’s affordable housing stock is woefully inadequate to address demographic and economic trends that continue to reshape this country, especially in light of other trends in healthcare and the social safety net.
There are 65 million older households in the U.S. The homeownership rate for those headed by someone 50 years or older is 76.2%, and 78.7% of households headed by someone 65 or older.
The Joint Center’s report notes that the majority of older households are white, and live in single-family homes. The demographic profile of older Americans, however, is likely to get more racially and ethnically diverse. And more older adults have been moving into multifamily housing, possibly because larger buildings are more likely to offer accessibility features.
More older households now consist of older unmarried adults who are doubling up, or living in multigenerational households. This is especially true among people age 65-79.
Perhaps The Joint Center’s greatest concern is the steady decline, since 2004, in the rate for households age 50–64, and an even sharper dip for adults approaching age 50. “Since this younger group is unlikely to match the homeownership rates of previous generations, many of these households will be unable to generate the same levels of wealth for retirement through equity building,” the report posits.
Nearly a quarter of households age 50 or older rent. Given that the median income of older renters ($28,000) is less than half that of older owners ($61,000), the decision to rent often comes out of necessity. Most of the 43% growth in the number of older renters since 2006 has, in fact, been among households earning under $30,000 per year.
Where people reside is an important factor in this analysis. Although the number of people age 65 and over living in dense urban areas grew by nearly 800,000 between 2000 and 2016, the share of all older adults living in such neighborhoods actually fell. Meanwhile, the shares living in low-density metro tracts rose significantly, from 24% to 32%—an increase of more than six million. The growing presence of older adults in lower-density communities largely results from aging in place.
The implication here is that it might be harder for older adults to find the healthcare and services they require as they age.
More seniors at a financial precipice
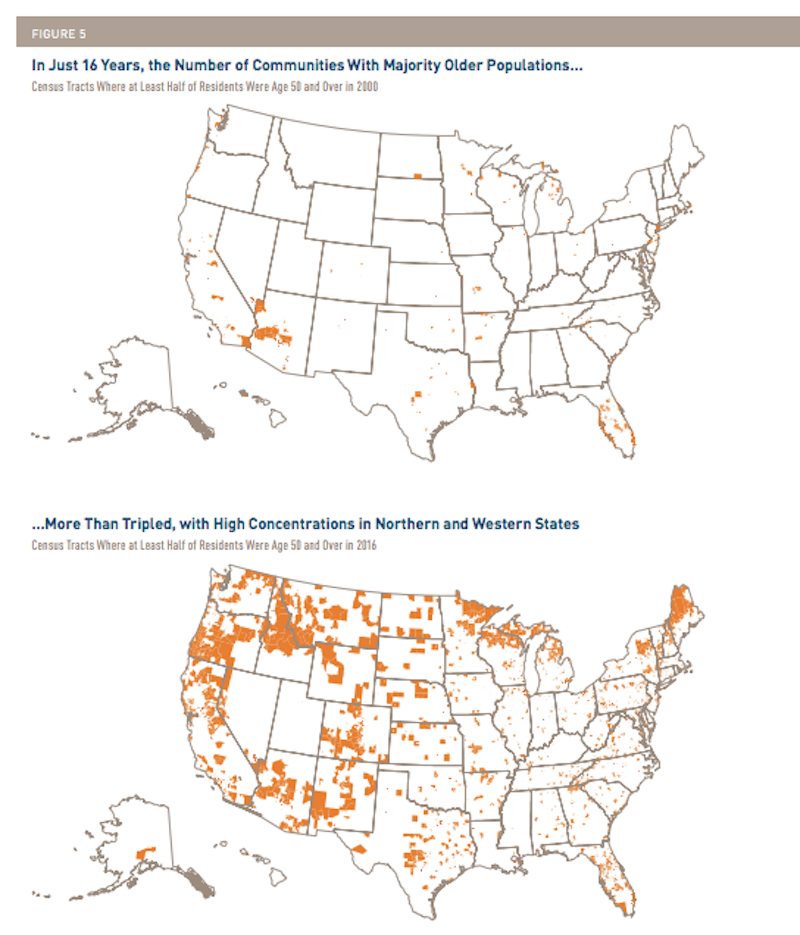
The U.S. housing market is ill-prepared to cope with the explosion of seniors across the country, a sizable proportion of whom are nearing retirement facing financial uncertainty. Image: Joint Center for Housign Studies
The median homeowner aged 50–64 had a net worth of $292,000 in 2016—almost 60 times that of the same-age median renter. Even excluding home equity, the net worth of owner households aged 50–64 was still nearly 30 times higher than that of same-age renters, while the net worth of owners age 65 and over was more than 24 times higher.
This disparity might explain why more Americans are working past 65. Over the past three decades, the labor force participation rate rose 12.8 percentage points for 65–69 year olds, and 9.5 points for 70–74 year olds. In 2017, 8.3% of the population age 75 and over was either employed or actively looking for work—nearly double the share 30 years ago.
It’s a good thing they’re working because more than two-fifths of owners 65 or older still have mortgages to pay off. Between 1989 and 2016, the loan-to-vale rations doubled to 51% for mortgage holders aged 50-64, and tripled to 39% for those age 65 or older.
The number of households age 65 and over with housing cost burdens continues to climb. In 2016, 9.7 million households in this age group—nearly a third—spent more than 30% of their incomes for housing. About 4.9 million were severely burdened, paying at least half their incomes for housing
Although the cost-burdened share of 50–64 year olds did decline a fraction of a point to 19.9% in 2014–2016, a total of 10.2 million households in this age group still faced at least moderate cost burdens, and nearly half of those households had severe burdens.
Social Security payments accounted for 69% of the income for the median older household in 2016. But between 2006 and 2016, Social Security payments rose just 6% in real terms while the median rent for households age 65 and over climbed at twice that rate. Looking ahead, the ability of many older adults to afford their housing will be closely tied to the fate of the Social Security program.
The financial precariousness of older Americans is exacerbated by healthcare concerns and costs that might limit their housing options. In 2016, 26% of households age 50 and over included a member with at least one vision, hearing, cognitive, self-care, mobility, or independent living difficulty. Difficulty climbing stairs or walking is the most common disability, affecting 17% of these households. Minority households are more likely than same-age white households to have at least one difficulty, although differences narrow over time.
Consider these statistics in light of the fact that few homes in the U.S. are accessible to people with mobility problems, particularly those requiring a wheelchair.
The good news is that that some older owners have come to grips with their possible debilities. The American Housing Survey shows that among owners age 65 and over who reported home-improvement spending in 2016–2017, 11% indicated that at least one of their projects was related to accessibility. Households in the 55-and-over age group already account for more than half of home improvement spending, and Joint Center projections suggest they will drive more than three-quarters of the growth in renovation spending in 2015–2025.
But renters, as well as owners with little wealth, may require government assistance to make their homes more accessible.
As if all this weren’t daunting enough, the Joint Center states that climate change doesn’t bode well for older adults who are much more at risk from extreme weather events and natural disasters than younger age groups.
The report’s outlook is another warning shot: Many households currently in their 50s and early 60s are not financially prepared for retirement, with lower homeownership rates than their predecessors and meager gains in income and wealth. In addition, many older adults live in low-density areas and in single-family homes, which adds to the pressures on their communities to provide new housing and transportation options for households in need. And as the baby boomers begin to turn 80 in the decade ahead, growing numbers of households will require affordable, accessible housing as well as supportive services.
State and local governments, as well as the private and nonprofit sectors, all have roles to play in developing more affordable and suitable housing for older households. Families and individuals also have a responsibility to plan for the future and to advocate for more age-friendly housing and communities. But given the current and growing scale of need, addressing the challenges of housing America’s older adults must also be a federal priority.
Related Stories

Hotel Facilities | Jul 27, 2023
U.S. hotel construction pipeline remains steady with 5,572 projects in the works
The hotel construction pipeline grew incrementally in Q2 2023 as developers and franchise companies push through short-term challenges while envisioning long-term prospects, according to Lodging Econometrics.

Hotel Facilities | Jul 26, 2023
Hospitality building construction costs for 2023
Data from Gordian breaks down the average cost per square foot for 15-story hotels, restaurants, fast food restaurants, and movie theaters across 10 U.S. cities: Boston, Chicago, Las Vegas, Los Angeles, Miami, New Orleans, New York, Phoenix, Seattle, and Washington, D.C.

Market Data | Jul 24, 2023
Leading economists call for 2% increase in building construction spending in 2024
Following a 19.7% surge in spending for commercial, institutional, and industrial buildings in 2023, leading construction industry economists expect spending growth to come back to earth in 2024, according to the July 2023 AIA Consensus Construction Forecast Panel.

Contractors | Jul 13, 2023
Construction input prices remain unchanged in June, inflation slowing
Construction input prices remained unchanged in June compared to the previous month, according to an Associated Builders and Contractors analysis of U.S. Bureau of Labor Statistics Producer Price Index data released today. Nonresidential construction input prices were also unchanged for the month.

Contractors | Jul 11, 2023
The average U.S. contractor has 8.9 months worth of construction work in the pipeline, as of June 2023
Associated Builders and Contractors reported that its Construction Backlog Indicator remained unchanged at 8.9 months in June 2023, according to an ABC member survey conducted June 20 to July 5. The reading is unchanged from June 2022.

Market Data | Jul 5, 2023
Nonresidential construction spending decreased in May, its first drop in nearly a year
National nonresidential construction spending decreased 0.2% in May, according to an Associated Builders and Contractors analysis of data published today by the U.S. Census Bureau. On a seasonally adjusted annualized basis, nonresidential spending totaled $1.06 trillion.

Apartments | Jun 27, 2023
Average U.S. apartment rent reached all-time high in May, at $1,716
Multifamily rents continued to increase through the first half of 2023, despite challenges for the sector and continuing economic uncertainty. But job growth has remained robust and new households keep forming, creating apartment demand and ongoing rent growth. The average U.S. apartment rent reached an all-time high of $1,716 in May.

Industry Research | Jun 15, 2023
Exurbs and emerging suburbs having fastest population growth, says Cushman & Wakefield
Recently released county and metro-level population growth data by the U.S. Census Bureau shows that the fastest growing areas are found in exurbs and emerging suburbs.

Contractors | Jun 13, 2023
The average U.S. contractor has 8.9 months worth of construction work in the pipeline, as of May 2023
Associated Builders and Contractors reported that its Construction Backlog Indicator remained unchanged at 8.9 months in May, according to an ABC member survey conducted May 20 to June 7. The reading is 0.1 months lower than in May 2022. Backlog in the infrastructure category ticked up again and has now returned to May 2022 levels. On a regional basis, backlog increased in every region but the Northeast.

Industry Research | Jun 13, 2023
Two new surveys track how the construction industry, in the U.S. and globally, is navigating market disruption and volatility
The surveys, conducted by XYZ Reality and KPMG International, found greater willingness to embrace technology, workplace diversity, and ESG precepts.


