

The GDP, which in 2020 contracted for the first time in 11 years, is expected to grow by 6.5% in 2021, and keep growing (albeit at a slower pace) in the proceeding two years. In 2021, the U.S. should recover about 60% of the 9.42 million jobs it lost last year, and pick up another 5.1 million jobs over the following two years. Consequently, the unemployment rate is expected to recede to 4% by the end of 2023, close to where it was pre-pandemic.
This economy and jobs picture, coupled with positive predictions about inflation, interest rates, and capitalization rates, sets the stage for the Urban Land Institute’s Real Estate Economic Forecast, released on May 19, which sees a sector poised to rebound, led by returns from single-family, hotel, and industrial assets. The biggest red flag is the office sector, whose national vacancy rates are expected to rise by a higher-than-usual three-year average, but to also recover starting in 2023.
The forecasts for 27 economic and real estate indicators, published in this report, ULI’s 19th, are derived from a survey this spring of 42 economists and analysts from 39 real estate organizations.
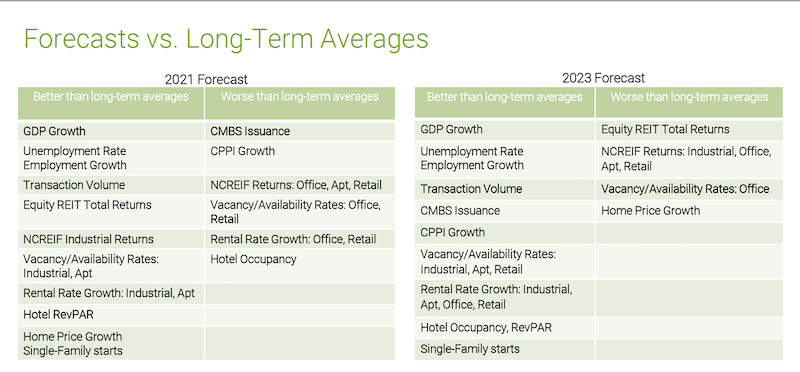
Commercial real estate should benefit from a strong economy through 2023. Graphic: ULI
Among the report’s notable findings are these:
• Commercial real estate transaction volume should recover quickly. It is expected to hit $500 billion this year and $550 billion next year. (The latest peak was $598 billion in 2019.) Commercial mortgage-backed securities issuance is projected at $70 billion this year, and to rise to $90 billion in 2023, exceeding the 20-year $82 billion average.
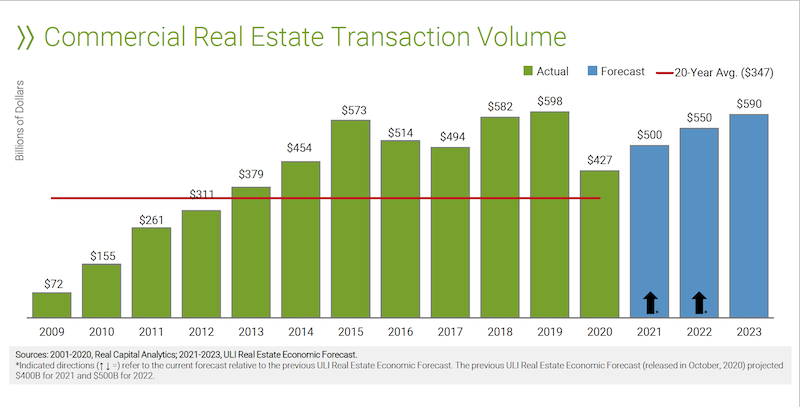
Transaction volume from real estate is expected to approach pre-pandemic levels again by 2023. Chart: ULI
• Price growth, as measured by the RCA Commercial Property Price Index, should remain below the 2020 level during all three proceeding years. The good news is that ULI is forecasting 5% increases in each of the next two years.
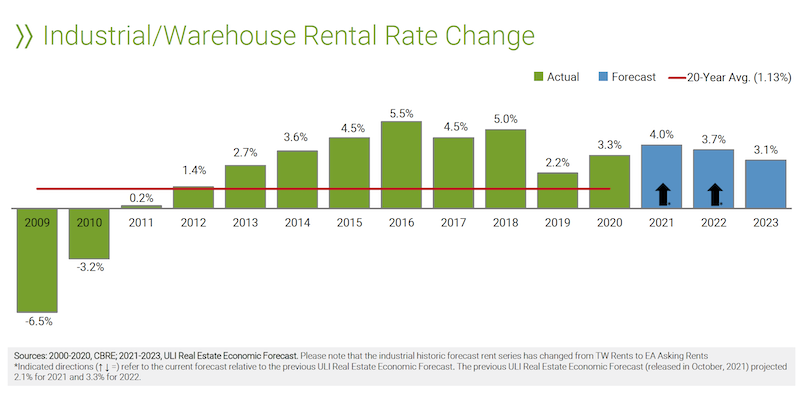
• Rent growth will be similarly volatile. Industrial rents will lead the pack with an average of 3.6% growth between 2021-2023. Multifamily rents will also rise, but office and retail rents are expected to stay in the negative column for a while.
As demand for industrial space increases, so will its rental rates. Charts: ULI
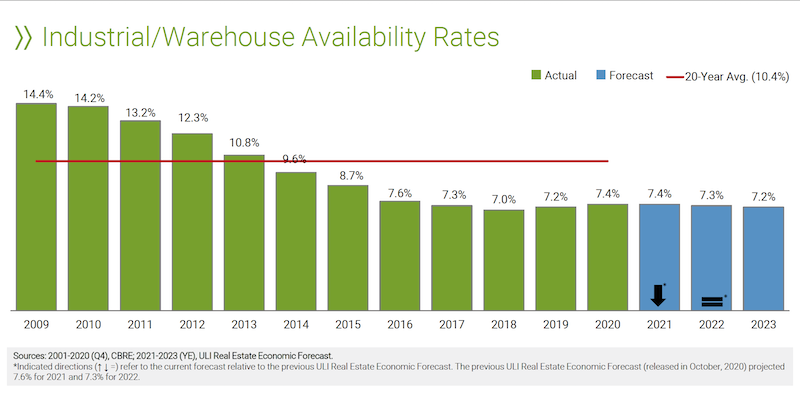
• The report looks at potential vacancy rates for five property types. Availability of warehouses and apartments is expected to remain below their 20-year averages over the next three years. Offices, on the other hand, will see vacancy rates rise to a three-year average of 16.2%, substantively above the sector’s 14.3% 20-year average. Retail vacancy rates, somewhat surprisingly, are projected to average 9.8%, below the sector’s 9.9% 20-year average.
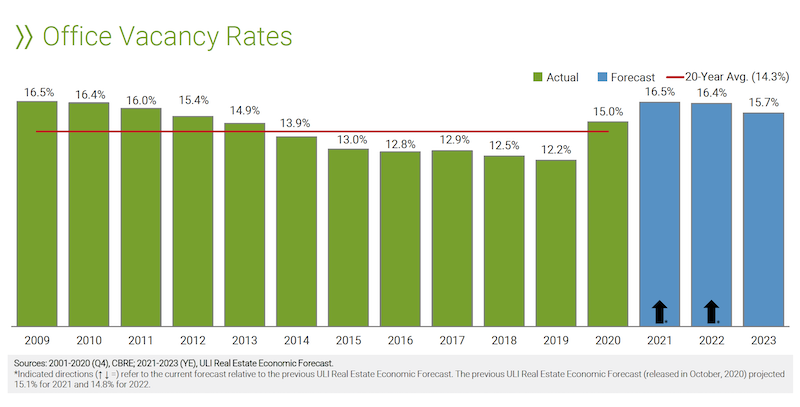
The office sector will have high vacancy rates for at least the next two years. Chart: ULI
• Last year, housing starts exceeded their 20-year average for the first time since the 2008-10 financial crisis. They are expected to hit 1.1 million units this year, and 1.2 million in 2022 and 2023.
• Real estate returns, as measured by the National Council of Real Estate Investment Fiduciaries, are forecast at 4.5%, 5.9%, and 6.5%, respectively, for 2021-2023. Industrial should lead all property types, but even office and retail are projected to generate positive returns.
Related Stories

Office Buildings | Jul 17, 2018
Transwestern report: Office buildings near transit earn 65% higher lease rates
Analysis of 15 major metros shows the average rent in central business districts was $43.48/sf for transit-accessible buildings versus $26.01/sf for car-dependent buildings.

Market Data | May 29, 2018
America’s fastest-growing cities: San Antonio, Phoenix lead population growth
San Antonio added 24,208 people between July 2016 and July 2017, according to U.S. Census Bureau data.

Industry Research | Jan 30, 2018
AIA’s Kermit Baker: Five signs of an impending upturn in construction spending
Tax reform implications and rebuilding from natural disasters are among the reasons AIA’s Chief Economist is optimistic for 2018 and 2019.

Market Data | Jan 30, 2018
AIA Consensus Forecast: 4.0% growth for nonresidential construction spending in 2018
The commercial office and retail sectors will lead the way in 2018, with a strong bounce back for education and healthcare.

Market Data | Jan 29, 2018
Year-end data show economy expanded in 2017; Fixed investment surged in fourth quarter
The economy expanded at an annual rate of 2.6% during the fourth quarter of 2017.

Market Data | Jan 25, 2018
Renters are the majority in 42 U.S. cities
Over the past 10 years, the number of renters has increased by 23 million.

Market Data | Jan 12, 2018
Construction input prices inch down in December, Up YOY despite low inflation
Energy prices have been more volatile lately.

Market Data | Jan 4, 2018
Nonresidential construction spending ticks higher in November, down year-over-year
Despite the month-over-month expansion, nonresidential spending fell 1.3 percent from November 2016.

Market Data | Dec 14, 2017
ABC chief economist predicts stable 2018 construction economy
There are risks to the 2018 outlook as a number of potential cost increases could come into play.

Market Data | Dec 11, 2017
Global hotel construction pipeline is growing
The Total Pipeline stands at 12,427 Projects/2,084,940 Rooms.


