

Demand for design services at architecture firms decreased in June in comparison to the previous month, according to a new report today from The American Institute of Architects (AIA).
AIA’s Architecture Billings Index (ABI) score for June was 49.1, which is down from 50.2 in May. Any score below 50 indicates a decrease in billings. Both the project inquiries index and the design contracts index continued to soften in June but remained positive.
“With billings declining or flat for the last five months, it appears that we are settling in for a period of soft demand for design services,” said AIA Chief Economist Kermit Baker, PhD, Hon. AIA. “With the new design contracts score reaching a 10-month low and the project inquiries score hitting a 10-year low, work in the pipeline may start to get worked off, despite current robust backlogs.”
Key ABI highlights for June include:
— Regional averages: South (51.9); West (49.3); Midwest (48.9); Northeast (46.1)
— Sector index breakdown: mixed practice (54.3); commercial/industrial (52.3); institutional (47.0); multi-family residential (46.3)
— Project inquiries index: 52.8
— Design contracts index: 50.3
The regional and sector categories are calculated as a three-month moving average, whereas the national index, design contracts and inquiries are monthly numbers.
Related Stories
Market Data | Apr 2, 2018
Construction spending in February inches up from January
Association officials urge federal, state and local officials to work quickly to put recently enacted funding increases to work to improve aging and over-burdened infrastructure, offset public-sector spending drops.

Market Data | Mar 29, 2018
AIA and the University of Minnesota partner to develop Guides for Equitable Practice
The Guides for Equitable Practice will be developed and implemented in three phase.

Market Data | Mar 22, 2018
Architecture billings continue to hold positive in 2018
Billings particularly strong at firms in the West and Midwest regions.

Market Data | Mar 21, 2018
Construction employment increases in 248 metro areas as new metal tariffs threaten future sector job gains
Riverside-San Bernardino-Ontario, Calif., and Merced, Calif., experience largest year-over-year gains; Baton Rouge, La., and Auburn-Opelika, Ala., have biggest annual declines in construction employment.
Market Data | Mar 19, 2018
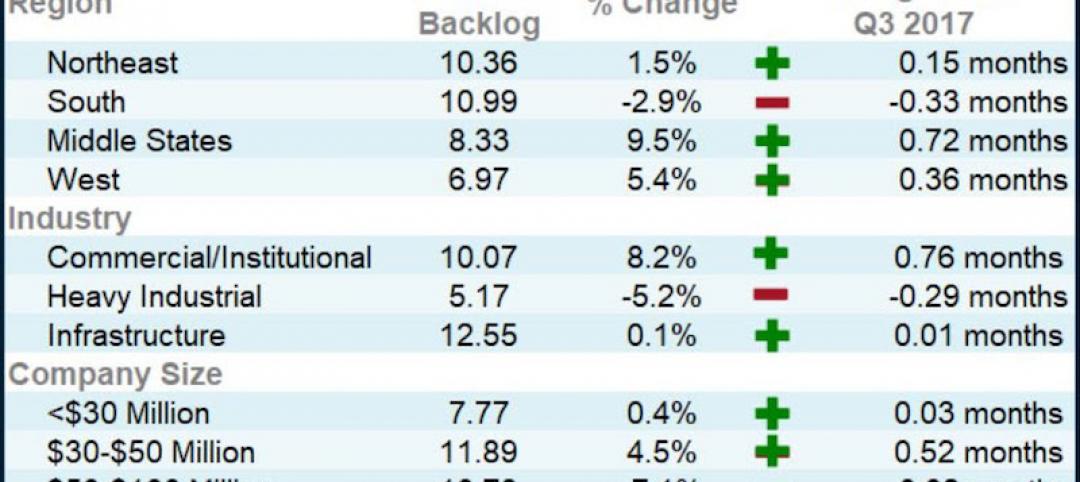
ABC's Construction Backlog Indicator hits a new high: 2018 poised to be a very strong year for construction spending
CBI is up by 1.36 months, or 16.3%, on a year-over-year basis.

Market Data | Mar 15, 2018
ABC: Construction materials prices continue to expand briskly in February
Compared to February 2017, prices are up 5.2%.

Market Data | Mar 14, 2018
AGC: Tariff increases threaten to make many project unaffordable
Construction costs escalated in February, driven by price increases for a wide range of building materials, including steel and aluminum.
Market Data | Mar 12, 2018
Construction employers add 61,000 jobs in February and 254,000 over the year
Hourly earnings rise 3.3% as sector strives to draw in new workers.

Steel Buildings | Mar 9, 2018
New steel and aluminum tariffs will hurt construction firms by raising materials costs; potential trade war will dampen demand, says AGC of America
Independent studies suggest the construction industry could lose nearly 30,000 jobs as a result of administration's new tariffs as many firms will be forced to absorb increased costs.

Market Data | Mar 8, 2018
Prioritizing your marketing initiatives
It’s time to take a comprehensive look at your plans and figure out the best way to get from Point A to Point B.


