

Total construction spending declined in September for the first time since February, as both residential and nonresidential construction slipped, according to a new analysis of federal construction spending data the Associated General Contractors of America released today. Officials urged the House of Representatives to promptly complete work on the bipartisan infrastructure bill that the Senate passed earlier this year, noting that spending on infrastructure in the first nine months of 2021 fell short of year-earlier levels.
“Spending on projects has been slowed by shortages of workers and materials, as well as extended or uncertain delivery times,” said Ken Simonson, the association’s chief economist. “And the extreme rise in materials costs is likely to mean some infrastructure projects will no longer be affordable without additional funding.”
Construction spending in September totaled $1.57 trillion at a seasonally adjusted annual rate, down 0.5% from August. Year-to-date spending in the first nine months of 2021 combined increased 7.1% from the total for January-September 2020. While both residential and nonresidential construction declined from August to September, the two categories have diverged relative to 2020 levels. Residential construction spending slipped 0.4% for the month but was 24.5% higher year-to-date. Combined private and public nonresidential construction spending decreased 0.6% in September and 5.8% year-to-date.
Most infrastructure categories posted significant year-to-date declines, Simonson pointed out. The largest public infrastructure segment, highway and street construction, was 1.3% lower than in January-September 2020. Spending on public transportation construction slumped 6.8% year-to-date. Investment in sewage and waste disposal structures was the sole exception, rising 4.3%, but public water supply projects dipped 0.9% and conservation and development construction plummeted 19.5%.
Other types of nonresidential spending also decreased year-to-date, Simonson added. Combined private and public spending on electric power and oil and gas projects declined 2.5%. Education construction slumped 10.1%. Commercial construction--comprising warehouse, retail, and farm structures--dipped 1.7%, as a 13.2% plunge in retail construction outweighed a 12.0% hike in warehouse structures. Office spending fell 9.2% and manufacturing construction inched down 0.2%.
Association officials said the almost ubiquitous downturn in infrastructure spending shows that enactment of the Bipartisan Infrastructure bill that already passed in the Senate is urgently needed. They said each day’s delay is putting the nation further behind in unclogging supply chains and enhancing competitiveness.
“This legislation advances the policy priorities that members of both parties have long said they want,” said Stephen E. Sandherr, the association’s chief executive officer. “It is disgraceful that both sides are still holding these projects hostage while sorting out other priorities. Construction workers, businesses, and the public deserve better.”
Related Stories

Market Data | Jan 25, 2018
Renters are the majority in 42 U.S. cities
Over the past 10 years, the number of renters has increased by 23 million.

Market Data | Jan 24, 2018
HomeUnion names the most and least affordable rental housing markets
Chicago tops the list as the most affordable U.S. metro, while Oakland, Calif., is the most expensive rental market.

Market Data | Jan 12, 2018
Construction input prices inch down in December, Up YOY despite low inflation
Energy prices have been more volatile lately.

Market Data | Jan 4, 2018
Nonresidential construction spending ticks higher in November, down year-over-year
Despite the month-over-month expansion, nonresidential spending fell 1.3 percent from November 2016.

Contractors | Jan 4, 2018
Construction spending in a ‘mature’ period of incremental growth
Labor shortages are spiking wages. Materials costs are rising, too.
 reported the November ABI score was 55.0, up from a score of 51.7 in the previous month. Photo: Pixabay")
Market Data | Dec 20, 2017
Architecture billings upturn shows broad strength
The American Institute of Architects (AIA) reported the November ABI score was 55.0, up from a score of 51.7 in the previous month.

Market Data | Dec 14, 2017
ABC chief economist predicts stable 2018 construction economy
There are risks to the 2018 outlook as a number of potential cost increases could come into play.

Market Data | Dec 13, 2017
Top world regions and markets in the global hotel construction pipeline
The top world region by project count is North America.

Market Data | Dec 11, 2017
Global hotel construction pipeline is growing
The Total Pipeline stands at 12,427 Projects/2,084,940 Rooms.
Market Data | Dec 11, 2017
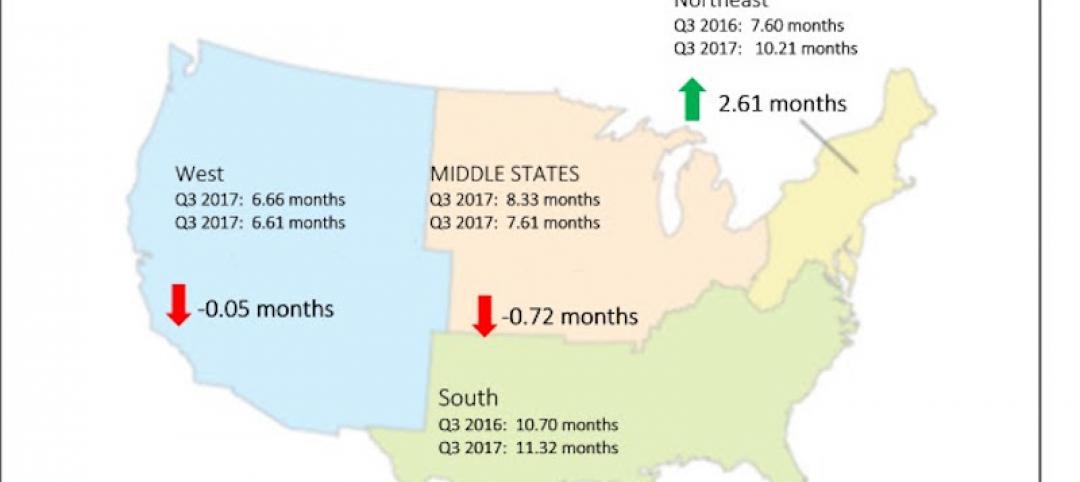
Construction backlog surges, sets record in third quarter
CBI is a leading economic indicator that reflects the amount of construction work under contract, but not yet completed.


