

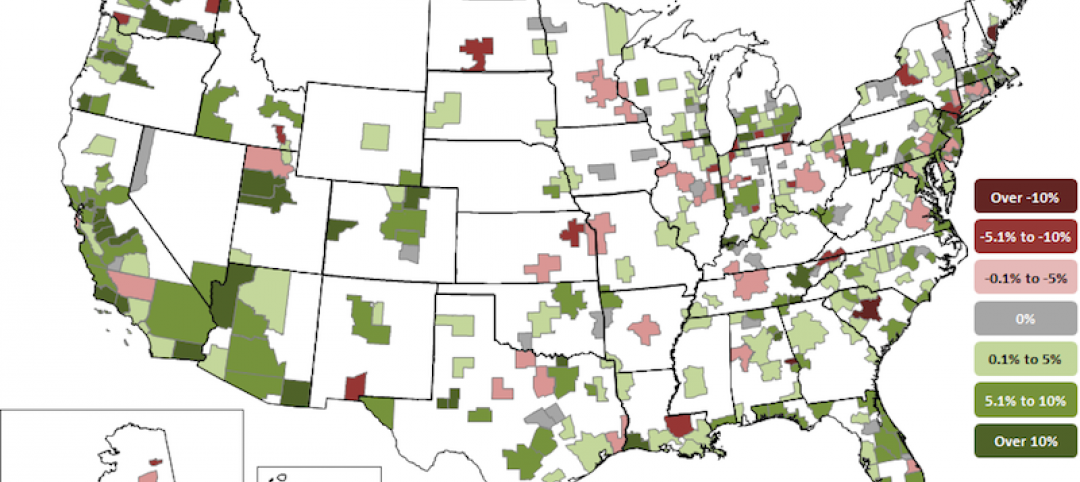
Construction employment declined in 91 metro areas and was stagnant in another 24 between February 2020, the last month before the pandemic, and May 2021, according to an analysis by the Associated General Contractors of America of government employment data released today. They said the high number of metro areas losing construction jobs during that time frame reflected the impacts of early pandemic shutdowns and more recent challenges procuring construction materials and finding qualified workers to hire.
“The devastating job losses of early 2020 and more recent materials and labor challenges since then have kept industry employment stagnant or lower this May than in February 2020 in nearly one-third of metros,” said Ken Simonson, the association’s chief economist. “Extreme lead times for producing and delivering materials, along with record prices for many items, has led to project delays and cancellations that have chilled hiring.”
Of the 91 metro areas with lower construction employment in May 2021 than in February 2020, Houston-The Woodlands-Sugar Land, Texas lost the most jobs: 30,500 or 13%. Major losses also occurred in New York City (-21,200 jobs, -13%); Midland, Texas (-9,600 jobs, -25%) and Odessa, Texas (-8,300 jobs, -40%). Odessa had the largest percentage decline, followed by Lake Charles, La. (-36%, -7,200 jobs); Midland; Laredo, Texas (-23%, -900 jobs) and Longview, Texas (-22%, -3,300 jobs).
Construction employment increased in 243 metro areas compared to the February 2020 level—far fewer than the 320 metros that typically add construction jobs between February and May, Simonson noted. Minneapolis-St. Paul-Bloomington, Minn.-Wis. added the most construction jobs over 15 months (11,100 jobs, 14%), followed by Indianapolis-Carmel-Anderson, Ind. (10,900 jobs, 21%); Chicago-Naperville-Arlington Heights, Ill. (10,300 jobs, 9%); Seattle-Bellevue-Everett, Wash. (6,900 jobs, 7%); and Pittsburgh, Pa. (6,900 jobs, 12%). Fargo, N.D.-Minn. had the highest percentage increase (45%, 3,300 jobs), followed by Sierra Vista-Douglas, Ariz. (44%, 1,100 jobs); and Bay City, Mich. (36%, 400 jobs).
Association officials said that many construction firms report challenges with rising materials prices, supply chain problems that are leading to delivery delays for key components and challenges finding qualified labor to hire. They urged the Biden administration and Congress to work together to remove tariffs on key construction materials, ease supply chain shortages and boost investments in career and technical education. They added that the association posted an updated Construction Inflation Alert to inform owners and officials about the worsening problems with rising materials costs, shipping delays and labor shortages.
“It is hard for the construction industry to grow while firms struggle to pay for and source key materials and have a hard time finding qualified workers to hire,” said Stephen E. Sandherr, the association’s chief executive officer. “Federal officials can help the industry and boost the economy by removing tariffs, easing supply chain backups and investing in workforce development.”
View the metro employment data, rankings, top 10, multi-division metros, and map. View the Alert.
Related Stories

Market Data | Jun 18, 2018
AI is the path to maximum profitability for retail and FMCG firms
Leading retailers including Amazon, Alibaba, Lowe’s and Tesco are developing their own AI solutions for automation, analytics and robotics use cases.

Market Data | Jun 12, 2018
Yardi Matrix report details industrial sector's strength
E-commerce and biopharmaceutical companies seeking space stoke record performances across key indicators.
Market Data | Jun 8, 2018
Dodge Momentum Index inches up in May
May’s gain was the result of a 4.7% increase by the commercial component of the Momentum Index.
Market Data | Jun 4, 2018
Nonresidential construction remains unchanged in April
Private sector spending increased 0.8% on a monthly basis and is up 5.3% from a year ago.
Market Data | May 30, 2018
Construction employment increases in 256 metro areas between April 2017 & 2018
Dallas-Plano-Irving and Midland, Texas experience largest year-over-year gains; St. Louis, Mo.-Ill. and Bloomington, Ill. have biggest annual declines in construction employment amid continuing demand.

Market Data | May 29, 2018
America’s fastest-growing cities: San Antonio, Phoenix lead population growth
San Antonio added 24,208 people between July 2016 and July 2017, according to U.S. Census Bureau data.
Market Data | May 25, 2018
Construction group uses mobile technology to make highway work zones safer
Mobile advertising campaign urges drivers who routinely pass through certain work zones to slow down and be alert as new data shows motorists are more likely to be injured than construction workers.

Market Data | May 23, 2018
Architecture firm billings strengthen in April
Firms report solid growth for seven straight months.
Market Data | May 22, 2018
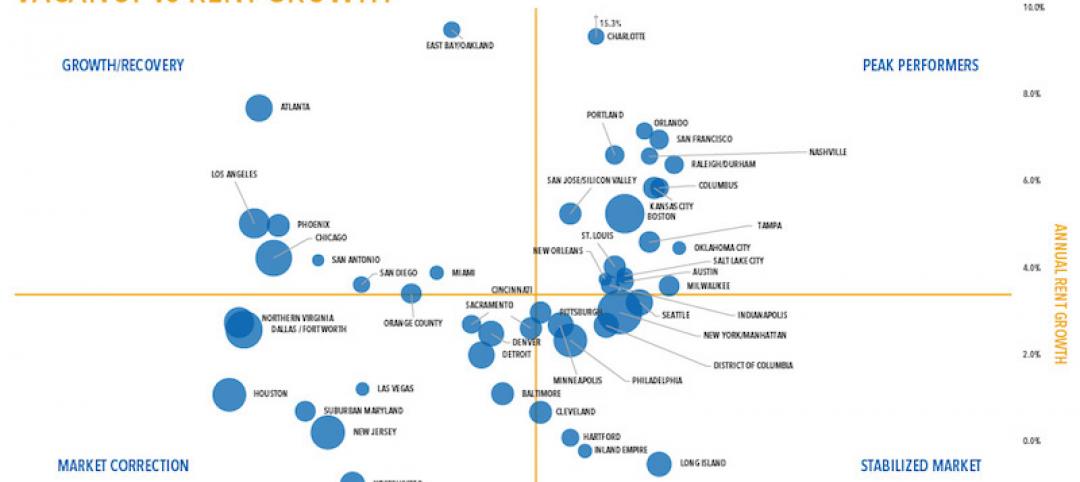
Vacancies stable, rents rising, and pipeline receding, according to Transwestern’s 1Q US Office Market report
The Big Apple still leads the new construction charge.

Market Data | May 18, 2018
Construction employment rises in 38 states and D.C. from April 2017 to April 2018
California & West Virginia have biggest annual job gains, North Dakota has largest decline; California & Louisiana have largest monthly pickup, Indiana & North Dakota lead monthly drops.


