

Thirty-nine states lost construction jobs between August 2019 and August 2020 while 31 states and the District of Columbia added construction jobs between July and August according to a new analysis of Labor Department data released today by the Associated General Contractors of America. The new annual figures detail how the coronavirus pandemic has undermined demand for construction projects after a strong start to the year.
“The ongoing pandemic is prompting ever more private owners, developers, and public agencies to delay and cancel projects,” said Ken Simonson, the association’s chief economist, citing the association’s mid-June survey and a more recent survey it produced in August. “The share of contractors that reported postponed or canceled projects nearly doubled while the share who reported winning new or expanded work dropped nearly in half.”
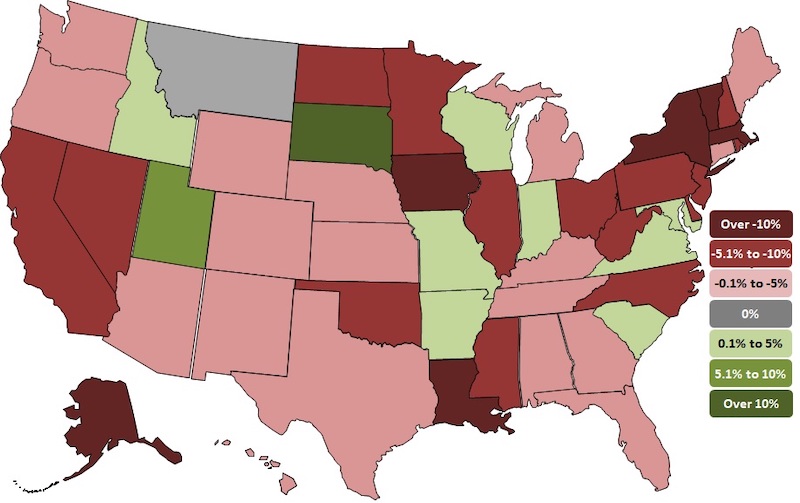
California lost the most construction jobs (-52,000, -5.8%) between August 2019 and August 2020, followed by New York (-46,000, -11.3%); Texas (-39,300 jobs, -5.0%); Massachusetts (-20,200 jobs, -12.4%) and Illinois (-17,200 jobs, -7.5%). Vermont lost the highest percent of construction jobs for the year (-29.6%, -4,500 jobs), followed by Massachusetts; Iowa (-11.8%, -9,300 jobs); Louisiana (-11.4%, -15,700 jobs) and New York.
Ten states and the District of Columbia added construction jobs between August 2019 and August 2020 while construction employment was unchanged in Montana. Utah added the most new construction jobs (8,800 jobs, 8.0%), followed by Virginia (4,400 jobs, 2.2%); Maryland (3,800 jobs, 2.3%); Indiana (3,100 jobs, 2.1%) and Missouri (2,700 jobs, 2.1%). South Dakota added the highest percent (10.9%, 2,600 jobs), followed by Utah; Idaho (2.4%, 1,300 jobs); Maryland and Virginia.
California added the most new construction jobs (6,700 jobs, 0.8%) between July and August, followed by New York (5,200 jobs, 1.5%); Pennsylvania (4,100 jobs, 1.7%); Texas (3,300 jobs, 0.4%) and Oregon (3,200 jobs, 3.1%). New Mexico added the highest percentage (6.7%, 3,100) of jobs for the month, followed by Mississippi (3.4%, 1,400 jobs); Oregon and Kentucky (2.0%, 1,600 jobs).
Nineteen states lost construction jobs for the month with Nevada losing the most (-2,600 jobs, -2.8%). Other states losing a high number of construction jobs for the month include Florida (-2,200 jobs, -0.4%); Nebraska (-1,800 jobs, -3.3%) and North Carolina (-1,800 jobs, -0.8%). Hawaii lost the highest percentage (-3.5%, -1,300 jobs) of construction jobs for the month, followed by West Virginia (-3.3%, -1,100 jobs); Nebraska and Nevada.
Association officials said the best thing Washington leaders can do to boost demand for construction and employment in the sector is to increase investments in infrastructure and provide liability protections for firms taking steps to protect workers from the coronavirus. They added that extending the current surface transportation bill for one-year – which appears likely to occur – will provide needed short-term certainty for the transportation construction market.
“The best way to create jobs and boost economic activity is to rebuild aging infrastructure, provide market certainty and protect firms from needless suits,” said Stephen E. Sandherr, the association’s chief executive officer.
View state employment data, 12-mo, 1-mo rankings, map and high and lows. View the workforce survey results.
Related Stories

Contractors | Apr 19, 2023
Rising labor, material prices cost subcontractors $97 billion in unplanned expenses
Subcontractors continue to bear the brunt of rising input costs for materials and labor, according to a survey of nearly 900 commercial construction professionals.

Data Centers | Apr 14, 2023
JLL's data center outlook: Cloud computing, AI driving exponential growth for data center industry
According to JLL’s new Global Data Center Outlook, the mass adoption of cloud computing and artificial intelligence (AI) is driving exponential growth for the data center industry, with hyperscale and edge computing leading investor demand.

Healthcare Facilities | Apr 13, 2023
Healthcare construction costs for 2023
Data from Gordian breaks down the average cost per square foot for a three-story hospital across 10 U.S. cities.

Higher Education | Apr 13, 2023
Higher education construction costs for 2023
Fresh data from Gordian breaks down the average cost per square foot for a two-story college classroom building across 10 U.S. cities.

Market Data | Apr 13, 2023
Construction input prices down year-over-year for first time since August 2020
Construction input prices increased 0.2% in March, according to an Associated Builders and Contractors analysis of U.S. Bureau of Labor Statistics Producer Price Index data released today. Nonresidential construction input prices rose 0.4% for the month.

Market Data | Apr 11, 2023
Construction crane count reaches all-time high in Q1 2023
Toronto, Seattle, Los Angeles, and Denver top the list of U.S/Canadian cities with the greatest number of fixed cranes on construction sites, according to Rider Levett Bucknall's RLB Crane Index for North America for Q1 2023.

Contractors | Apr 11, 2023
The average U.S. contractor has 8.7 months worth of construction work in the pipeline, as of March 2023
Associated Builders and Contractors reported that its Construction Backlog Indicator declined to 8.7 months in March, according to an ABC member survey conducted March 20 to April 3. The reading is 0.4 months higher than in March 2022.

Market Data | Apr 6, 2023
JLL’s 2023 Construction Outlook foresees growth tempered by cost increases
The easing of supply chain snags for some product categories, and the dispensing with global COVID measures, have returned the North American construction sector to a sense of normal. However, that return is proving to be complicated, with the construction industry remaining exceptionally busy at a time when labor and materials cost inflation continues to put pricing pressure on projects, leading to caution in anticipation of a possible downturn. That’s the prognosis of JLL’s just-released 2023 U.S. and Canada Construction Outlook.

Market Data | Apr 4, 2023
Nonresidential construction spending up 0.4% in February 2023
National nonresidential construction spending increased 0.4% in February, according to an Associated Builders and Contractors analysis of data published by the U.S. Census Bureau. On a seasonally adjusted annualized basis, nonresidential spending totaled $982.2 billion for the month, up 16.8% from the previous year.

Multifamily Housing | Mar 24, 2023
Average size of new apartments dropped sharply in 2022
The average size of new apartments in 2022 dropped sharply in 2022, as tracked by RentCafe. Across the U.S., the average new apartment size was 887 sf, down 30 sf from 2021, which was the largest year-over-year decrease.


