

Thirty-nine states lost construction jobs between August 2019 and August 2020 while 31 states and the District of Columbia added construction jobs between July and August according to a new analysis of Labor Department data released today by the Associated General Contractors of America. The new annual figures detail how the coronavirus pandemic has undermined demand for construction projects after a strong start to the year.
“The ongoing pandemic is prompting ever more private owners, developers, and public agencies to delay and cancel projects,” said Ken Simonson, the association’s chief economist, citing the association’s mid-June survey and a more recent survey it produced in August. “The share of contractors that reported postponed or canceled projects nearly doubled while the share who reported winning new or expanded work dropped nearly in half.”
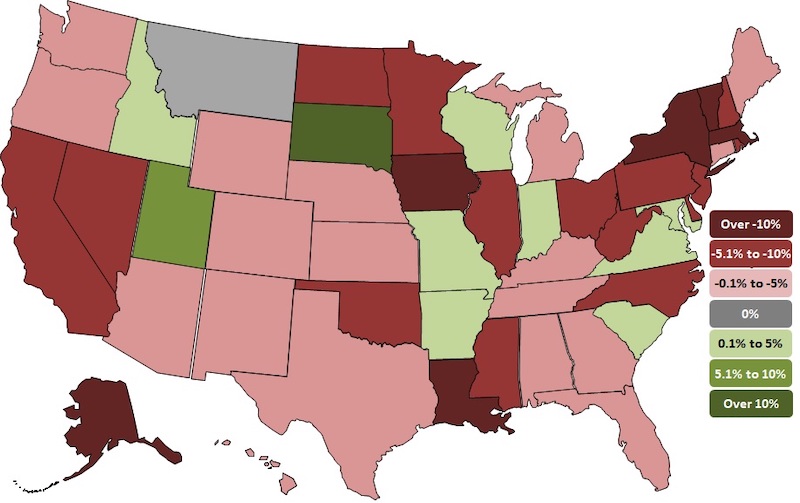
California lost the most construction jobs (-52,000, -5.8%) between August 2019 and August 2020, followed by New York (-46,000, -11.3%); Texas (-39,300 jobs, -5.0%); Massachusetts (-20,200 jobs, -12.4%) and Illinois (-17,200 jobs, -7.5%). Vermont lost the highest percent of construction jobs for the year (-29.6%, -4,500 jobs), followed by Massachusetts; Iowa (-11.8%, -9,300 jobs); Louisiana (-11.4%, -15,700 jobs) and New York.
Ten states and the District of Columbia added construction jobs between August 2019 and August 2020 while construction employment was unchanged in Montana. Utah added the most new construction jobs (8,800 jobs, 8.0%), followed by Virginia (4,400 jobs, 2.2%); Maryland (3,800 jobs, 2.3%); Indiana (3,100 jobs, 2.1%) and Missouri (2,700 jobs, 2.1%). South Dakota added the highest percent (10.9%, 2,600 jobs), followed by Utah; Idaho (2.4%, 1,300 jobs); Maryland and Virginia.
California added the most new construction jobs (6,700 jobs, 0.8%) between July and August, followed by New York (5,200 jobs, 1.5%); Pennsylvania (4,100 jobs, 1.7%); Texas (3,300 jobs, 0.4%) and Oregon (3,200 jobs, 3.1%). New Mexico added the highest percentage (6.7%, 3,100) of jobs for the month, followed by Mississippi (3.4%, 1,400 jobs); Oregon and Kentucky (2.0%, 1,600 jobs).
Nineteen states lost construction jobs for the month with Nevada losing the most (-2,600 jobs, -2.8%). Other states losing a high number of construction jobs for the month include Florida (-2,200 jobs, -0.4%); Nebraska (-1,800 jobs, -3.3%) and North Carolina (-1,800 jobs, -0.8%). Hawaii lost the highest percentage (-3.5%, -1,300 jobs) of construction jobs for the month, followed by West Virginia (-3.3%, -1,100 jobs); Nebraska and Nevada.
Association officials said the best thing Washington leaders can do to boost demand for construction and employment in the sector is to increase investments in infrastructure and provide liability protections for firms taking steps to protect workers from the coronavirus. They added that extending the current surface transportation bill for one-year – which appears likely to occur – will provide needed short-term certainty for the transportation construction market.
“The best way to create jobs and boost economic activity is to rebuild aging infrastructure, provide market certainty and protect firms from needless suits,” said Stephen E. Sandherr, the association’s chief executive officer.
View state employment data, 12-mo, 1-mo rankings, map and high and lows. View the workforce survey results.
Related Stories

Multifamily Housing | Jan 15, 2024
Multifamily rent growth rate unchanged at 0.3%
The National Multifamily Report by Yardi Matrix highlights the highs and lows of the multifamily market in 2023. Despite strong demand, rent growth remained unchanged at 0.3 percent.

Self-Storage Facilities | Jan 5, 2024
The state of self-storage in early 2024
As the housing market cools down, storage facilities suffer from lower occupancy and falling rates, according to the December 2023 Yardi Matrix National Self Storage Report.

Designers | Dec 25, 2023
Redefining the workplace is a central theme in Gensler’s latest Design Report
The firm identifies eight mega trends that mostly stress human connections.

Contractors | Dec 12, 2023
The average U.S. contractor has 8.5 months worth of construction work in the pipeline, as of November 2023
Associated Builders and Contractors reported today that its Construction Backlog Indicator inched up to 8.5 months in November from 8.4 months in October, according to an ABC member survey conducted Nov. 20 to Dec. 4. The reading is down 0.7 months from November 2022.

Market Data | Nov 27, 2023
Number of employees returning to the office varies significantly by city
While the return-to-the-office trend is felt across the country, the percentage of employees moving back to their offices varies significantly according to geography, according to Eptura’s Q3 Workplace Index.

Market Data | Nov 14, 2023
The average U.S. contractor has 8.4 months worth of construction work in the pipeline, as of September 2023
Associated Builders and Contractors reported that its Construction Backlog Indicator declined to 8.4 months in October from 9.0 months in September, according to an ABC member survey conducted from Oct. 19 to Nov. 2. The reading is down 0.4 months from October 2022. Backlog now stands at its lowest level since the first quarter of 2022.

Multifamily Housing | Nov 9, 2023
Multifamily project completions forecast to slow starting 2026
Yardi Matrix has released its Q4 2023 Multifamily Supply Forecast, emphasizing a short-term spike and plateau of new construction.

Contractors | Nov 1, 2023
Nonresidential construction spending increases for the 16th straight month, in September 2023
National nonresidential construction spending increased 0.3% in September, according to an Associated Builders and Contractors analysis of data published today by the U.S. Census Bureau. On a seasonally adjusted annualized basis, nonresidential spending totaled $1.1 trillion.

Market Data | Oct 23, 2023
New data finds that the majority of renters are cost-burdened
The most recent data derived from the 2022 Census American Community Survey reveals that the proportion of American renters facing housing cost burdens has reached its highest point since 2012, undoing the progress made in the ten years leading up to the pandemic.

Contractors | Oct 19, 2023
Crane Index indicates slowing private-sector construction
Private-sector construction in major North American cities is slowing, according to the latest RLB Crane Index. The number of tower cranes in use declined 10% since the first quarter of 2023. The index, compiled by consulting firm Rider Levett Bucknall (RLB), found that only two of 14 cities—Boston and Toronto—saw increased crane counts.


