

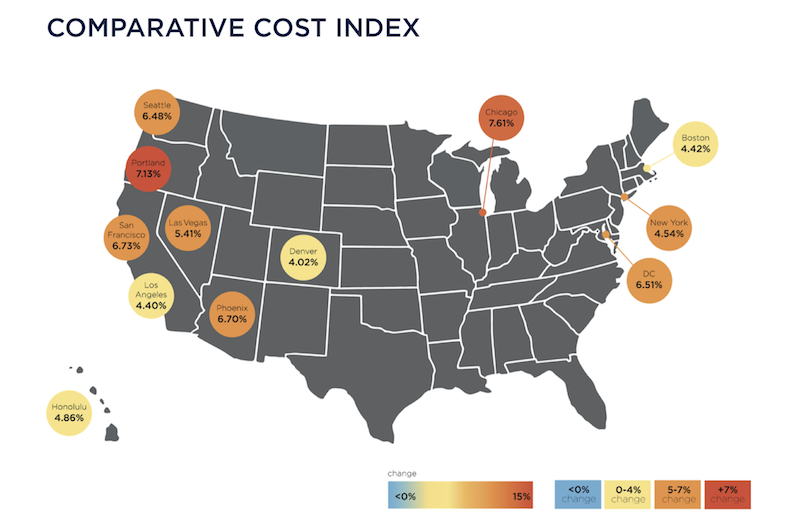
Construction costs nationally rose in 2018 by an average of 5.73%, with Chicago and Portland, Ore., showing the greatest increases among major cities.
Costs rose at a time when many markets are at or near their construction-activity cycle, and as industry unemployment remained higher than the country’s at large.
Those are two findings in the latest Quarterly Construction Cost Report for North America, released by the property and construction consultant Rider Levett Bucknall (RLB), and based on an analysis of 15 building typologies in 14 metros. (The sectors analyzed include single- and multifamily housing, as well as parking structures.)
The full quarterly report can be accessed here.
The U.S. Department of Commerce estimates that, as of January 2019, the seasonally adjusted annual rate for Construction Put-in-Place was just under $1.28 trillion, 0.3% above the same monthly estimate a year earlier.
However, the National Construction Cost Index has been on a fairly steady upward trajectory since the first quarter of 2014. As of the first quarter of 2019, that Index stood at 198.33 (relative to the April 2001 base of 100, recalibrated as of April 2011).
Some examples of RLB’s findings include its estimate that the cost of building prime office space is highest in Boston and New York, lowest in Phoenix and Denver. Los Angeles has the highest construction costs for hospitals, and Las Vegas the lowest for elementary schools.
Eight of the 14 markets analyzed were at their construction-activity peaks by the end of last year. Chicago’s construction costs, in general, increased the most (7.61%, to $22.8 billion) among the metros analyzed, even though it was the only city that fell into the “mid decline” category for construction activity. Honolulu, the only city in “trough growth,” saw construction costs rise by 4.86% to $24.8 billion.
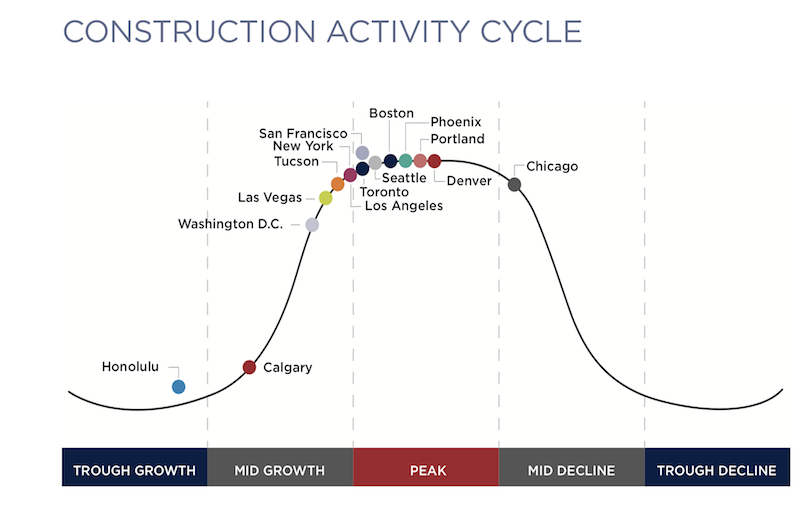 Eight of the 14 metros tracked are at the top of their constuction cycles. Image: RLB
San Francisco had the highest construction put-in-place, $26.844 billion, up 6.73%.
Increasingly expensive construction activity occurred despite a decrease in architectural billings, and an industry unemployment rate that, at 5.1% in the fourth quarter of last year, was down from 7.4% in the first quarter of 2018.
The U.S. Gross Domestic Product closed out the fourth quarter at 2.6%, down from a mid-year peak of 4.2%. Inflation last year was up only 1.91%.
The report also analyzes construction costs in Canada, specifically Calgary, Alberta, and Toronto, Ontario. RLB notes that those two cities are driving much of the growth in Canada’s economy.
Related Stories

K-12 Schools | Apr 10, 2024
Surprise, surprise: Students excel in modernized K-12 school buildings
Too many of the nation’s school districts are having to make it work with less-than-ideal educational facilities. But at what cost to student performance and staff satisfaction?

Multifamily Housing | Apr 9, 2024
March reports record gains in multifamily rent growth in 20 months
Asking rents for multifamily units increased $8 during the month to $1,721; year-over-year growth grew 30 basis points to 0.9 percent—a normal seasonal growth pattern according to Yardi Matrix.

Retail Centers | Apr 4, 2024
Retail design trends: Consumers are looking for wellness in where they shop
Consumers are making lifestyle choices with wellness in mind, which ignites in them a feeling of purpose and a sense of motivation. That’s the conclusion that the architecture and design firm MG2 draws from a survey of 1,182 U.S. adult consumers the firm conducted last December about retail design and what consumers want in healthier shopping experiences.

Market Data | Apr 1, 2024
Nonresidential construction spending dips 1.0% in February, reaches $1.179 trillion
National nonresidential construction spending declined 1.0% in February, according to an Associated Builders and Contractors analysis of data published today by the U.S. Census Bureau. On a seasonally adjusted annualized basis, nonresidential spending totaled $1.179 trillion.

Market Data | Mar 26, 2024
Architecture firm billings see modest easing in February
Architecture firm billings continued to decline in February, with an AIA/Deltek Architecture Billings Index (ABI) score of 49.5 for the month. However, February’s score marks the most modest easing in billings since July 2023 and suggests that the recent slowdown may be receding.

K-12 Schools | Mar 18, 2024
New study shows connections between K-12 school modernizations, improved test scores, graduation rates
Conducted by Drexel University in conjunction with Perkins Eastman, the research study reveals K-12 school modernizations significantly impact key educational indicators, including test scores, graduation rates, and enrollment over time.

MFPRO+ News | Mar 16, 2024
Multifamily rents stable heading into spring 2024
National asking multifamily rents posted their first increase in over seven months in February. The average U.S. asking rent rose $1 to $1,713 in February 2024, up 0.6% year-over-year.

Market Data | Mar 14, 2024
Download BD+C's March 2024 Market Intelligence Report
U.S. construction spending on buildings-related work rose 1.4% in January, but project teams continue to face headwinds related to inflation, interest rates, and supply chain issues, according to Building Design+Construction's March 2024 Market Intelligence Report (free PDF download).

Contractors | Mar 12, 2024
The average U.S. contractor has 8.1 months worth of construction work in the pipeline, as of February 2024
Associated Builders and Contractors reported that its Construction Backlog Indicator declined to 8.1 months in February, according to an ABC member survey conducted Feb. 20 to March 5. The reading is down 1.1 months from February 2023.

Market Data | Mar 6, 2024
Nonresidential construction spending slips 0.4% in January
National nonresidential construction spending decreased 0.4% in January, according to an Associated Builders and Contractors analysis of data published today by the U.S. Census Bureau. On a seasonally adjusted annualized basis, nonresidential spending totaled $1.190 trillion.


