


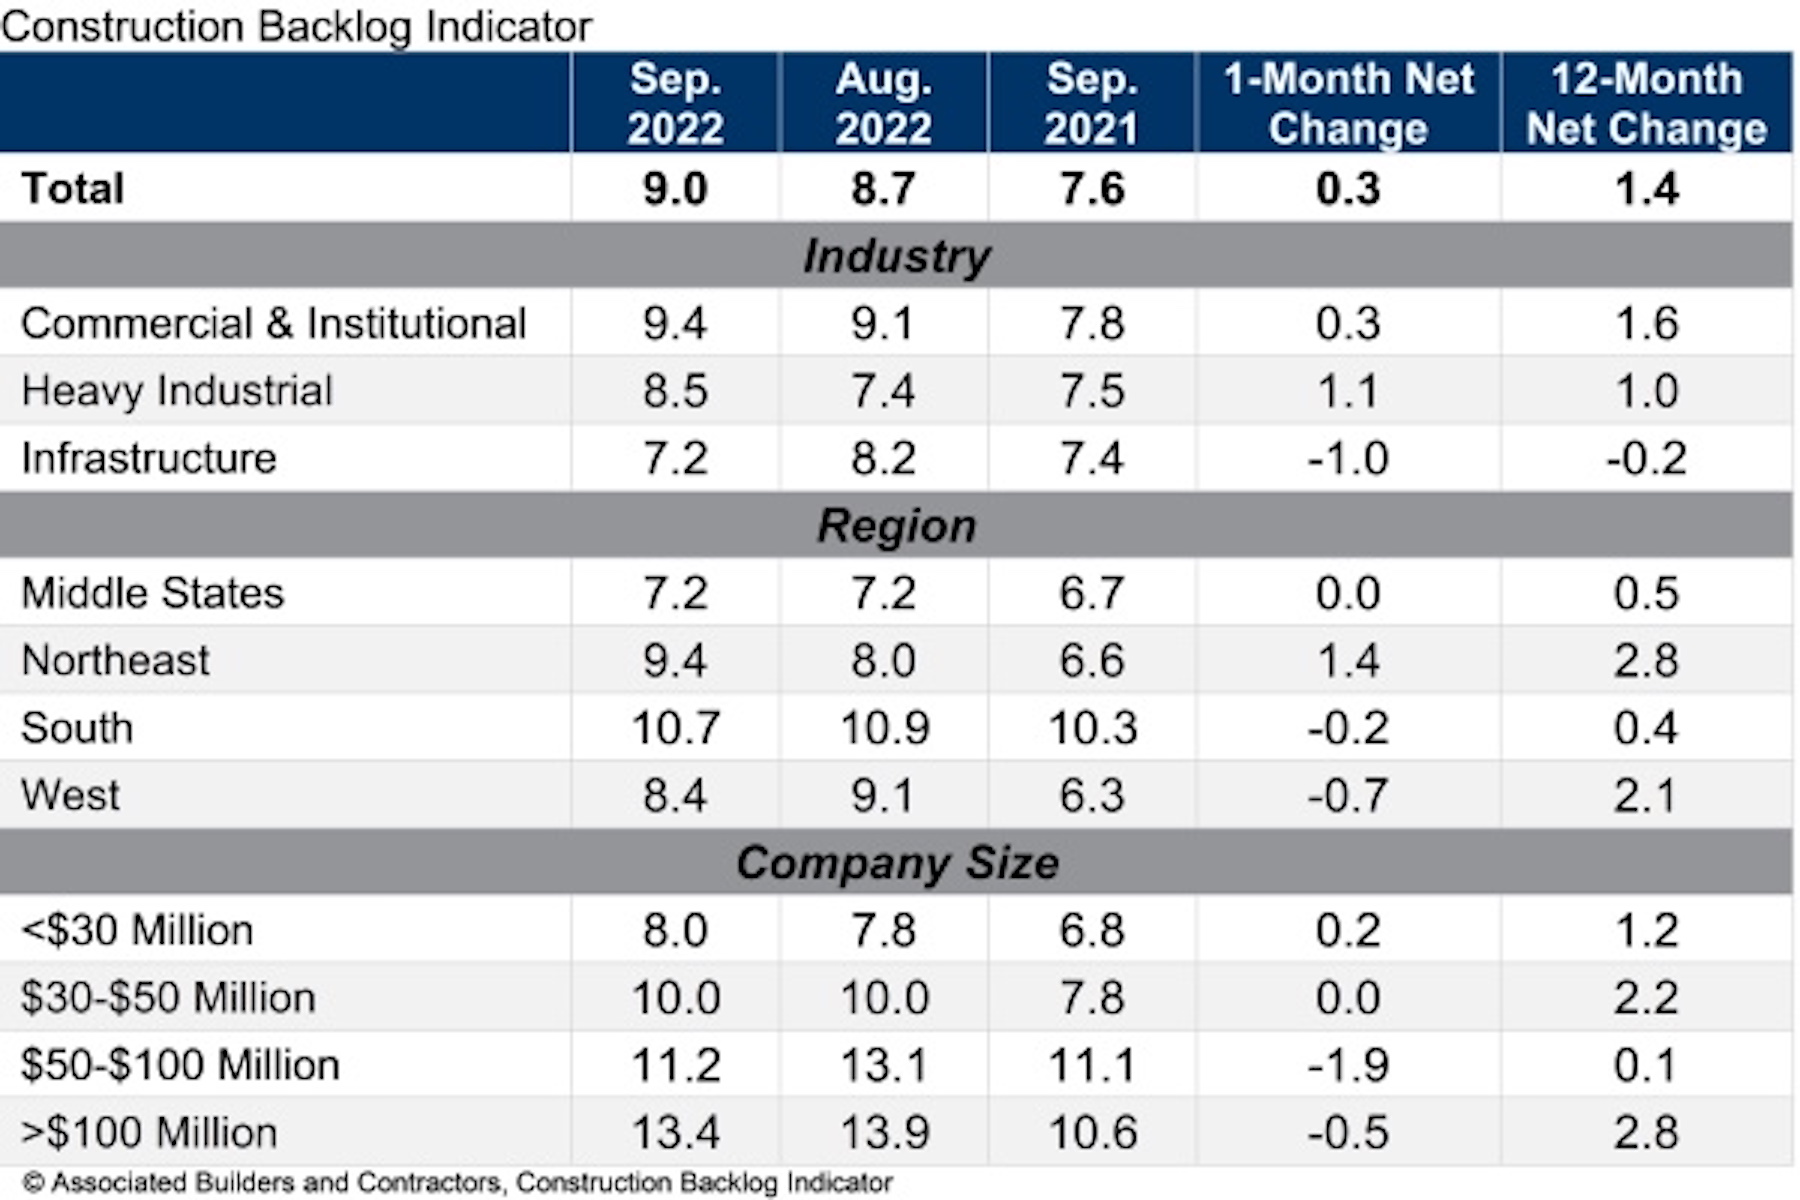
Associated Builders and Contractors reports today that its Construction Backlog Indicator increased to 9.0 months in September, according to an ABC member survey conducted Sept. 20 to Oct. 5. The reading is 1.4 months higher than in September 2021.
View ABC’s Construction Backlog Indicator and Construction Confidence Index tables for September 2022.
Backlog reached its highest level since May 2022 and is once again above the level observed at the start of the pandemic (8.9 months in February 2020). Backlog in heavy industrial increased sizably in September, spurred by a 21.5% year-over-year increase in manufacturing-related construction spending.
ABC’s Construction Confidence Index readings for profit margins and staffing levels increased in September, while the reading for sales moved slightly lower. All three readings remain above the threshold of 50, indicating expectations of growth over the next six months.
“The construction confidence and backlog metrics appear strong despite the U.S. economy facing headwinds like inflation, financial market volatility and rapidly rising borrowing costs,” said ABC Chief Economist Anirban Basu. “Contractors remain decidedly upbeat, with backlog expanding and expectations for rising sales, employment and profit margins over the next six months.
“One would think the recent surge in interest rates would be enough to dampen contractor confidence,” said Basu. “Instead, project owners continue to move forward with a significant number of projects. Faced with high demand for their services, contractors continue to show pricing power, helping to offset rising compensation and other construction delivery costs.”
Note: The reference months for the Construction Backlog Indicator and Construction Confidence Index data series were revised on May 12, 2020, to better reflect the survey period. CBI quantifies the previous month’s work under contract based on the latest financials available, while CCI measures contractors’ outlook for the next six months.
Related Stories

Market Data | May 24, 2017
Design billings increasing entering height of construction season
All regions report positive business conditions.

Market Data | May 24, 2017
The top franchise companies in the construction pipeline
3 franchise companies comprise 65% of all rooms in the Total Pipeline.

Industry Research | May 24, 2017
These buildings paid the highest property taxes in 2016
Office buildings dominate the list, but a residential community climbed as high as number two on the list.

Market Data | May 16, 2017
Construction firms add 5,000 jobs in April
Unemployment down to 4.4%; Specialty trade jobs dip slightly.

Multifamily Housing | May 10, 2017
May 2017 National Apartment Report
Median one-bedroom rent rose to $1,012 in April, the highest it has been since January.

Senior Living Design | May 9, 2017
Designing for a future of limited mobility
There is an accessibility challenge facing the U.S. An estimated 1 in 5 people will be aged 65 or older by 2040.

Industry Research | May 4, 2017
How your AEC firm can go from the shortlist to winning new business
Here are four key lessons to help you close more business.

Engineers | May 3, 2017
At first buoyed by Trump election, U.S. engineers now less optimistic about markets, new survey shows
The first quarter 2017 (Q1/17) of ACEC’s Engineering Business Index (EBI) dipped slightly (0.5 points) to 66.0.

Market Data | May 2, 2017
Nonresidential Spending loses steam after strong start to year
Spending in the segment totaled $708.6 billion on a seasonally adjusted, annualized basis.

Market Data | May 1, 2017
Nonresidential Fixed Investment surges despite sluggish economic in first quarter
Real gross domestic product (GDP) expanded 0.7 percent on a seasonally adjusted annualized rate during the first three months of the year.


