

In its latest report on the U.S. office market, JLL notes that a second-quarter rebound this year delivered 11.7 million sf of new office space. Much of what’s being built in the office sector is occurring in the central business districts of cities around the country, as companies gravitate closer to where they believe they’ll have their best shots at attracting Millennial workers.
But to paraphrase Mark Twain, news of the death of suburban office space may be greatly exaggerated. Corporate America hasn’t quite abandoned the suburbs to the extent that some experts were predicting not to long ago.
In its Second-Quarter 2017 Office Market Report, Transwestern singles out New Jersey, where “renewed interest” in suburban office properties helped push the Garden State’s overall average office rents to $26.42 per sf, nearly $2 per sf higher than five years ago and the market’s highest mid-year level since 2001.
CBRE this summer looked at the 25 largest suburban markets it covers, and found “they have performed better than is commonly perceived.” CBRE went on to state that suburban office submarkets with urban characteristics—higher densities of office space, housing, and retail, as well as transportation access—are in the best position to capture occupier demand.
CBRE also found that rents in more than half of the most established suburban submarkets exceed their downtown counterparts.
Despite the flight from suburbs to cities over the past few years by such high-profile companies as General Electric, McDonald’s, Aetna, and ConAgra, suburban and urban office properties that collateralize commercial mortgage-backed securities (CMBS) loans have comparable occupancy rates (89.1% vs. 89.6%), according to a new analysis by Trepp, a leading data provider to the CMBS and banking industries.
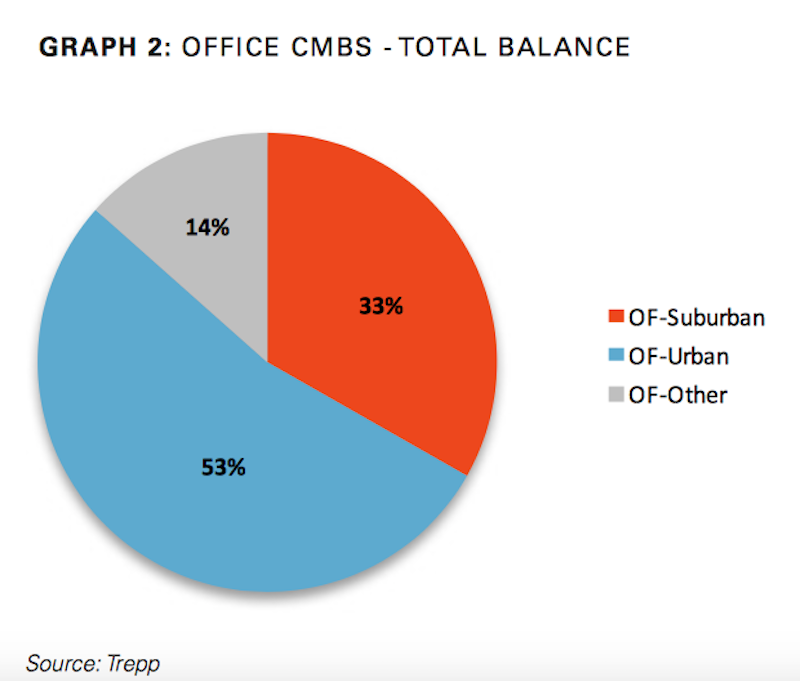
Suburban office loans account for one-third of outstanding CMBS debt. However, they are often more distressed than urban office loans, and have higher rates of delinquency. Image: Trepp
Trepp estimates that suburban office loans account for one-third of the $125.1 billion in outstanding CMBS debt. And new issuance for suburban offices reached $3.2 billion in the first half of 2017, up 43% compared to the same period a year ago. Trepp infers that from these data that “demand is still relatively steady” for suburban office space.
There are caveats, though, not the least of which being that suburban offices carry the highest percentage of distressed debt in the sector: 14.5%, compared to 4.9% for urban office loans. Suburban office loans also carry a noticeably high delinquency rate: 13.3%, which is down from 15.9% in April, but still nearly five percentage points higher than the broader office sector’s delinquencies.
In its analysis, Trepp quotes from Hartford Business, a journal in Connecticut, which observes that the nationwide migration toward urban office space is often a management trend, where companies are reallocating resources and their top talent to office space in cities, but still keep the bulk of their employees in suburban offices.
Related Stories

Market Data | Apr 16, 2024
The average U.S. contractor has 8.2 months worth of construction work in the pipeline, as of March 2024
Associated Builders and Contractors reported today that its Construction Backlog Indicator increased to 8.2 months in March from 8.1 months in February, according to an ABC member survey conducted March 20 to April 3. The reading is down 0.5 months from March 2023.

K-12 Schools | Apr 10, 2024
Surprise, surprise: Students excel in modernized K-12 school buildings
Too many of the nation’s school districts are having to make it work with less-than-ideal educational facilities. But at what cost to student performance and staff satisfaction?

Multifamily Housing | Apr 9, 2024
March reports record gains in multifamily rent growth in 20 months
Asking rents for multifamily units increased $8 during the month to $1,721; year-over-year growth grew 30 basis points to 0.9 percent—a normal seasonal growth pattern according to Yardi Matrix.

Retail Centers | Apr 4, 2024
Retail design trends: Consumers are looking for wellness in where they shop
Consumers are making lifestyle choices with wellness in mind, which ignites in them a feeling of purpose and a sense of motivation. That’s the conclusion that the architecture and design firm MG2 draws from a survey of 1,182 U.S. adult consumers the firm conducted last December about retail design and what consumers want in healthier shopping experiences.

Market Data | Apr 1, 2024
Nonresidential construction spending dips 1.0% in February, reaches $1.179 trillion
National nonresidential construction spending declined 1.0% in February, according to an Associated Builders and Contractors analysis of data published today by the U.S. Census Bureau. On a seasonally adjusted annualized basis, nonresidential spending totaled $1.179 trillion.

Market Data | Mar 26, 2024
Architecture firm billings see modest easing in February
Architecture firm billings continued to decline in February, with an AIA/Deltek Architecture Billings Index (ABI) score of 49.5 for the month. However, February’s score marks the most modest easing in billings since July 2023 and suggests that the recent slowdown may be receding.

K-12 Schools | Mar 18, 2024
New study shows connections between K-12 school modernizations, improved test scores, graduation rates
Conducted by Drexel University in conjunction with Perkins Eastman, the research study reveals K-12 school modernizations significantly impact key educational indicators, including test scores, graduation rates, and enrollment over time.

MFPRO+ News | Mar 16, 2024
Multifamily rents stable heading into spring 2024
National asking multifamily rents posted their first increase in over seven months in February. The average U.S. asking rent rose $1 to $1,713 in February 2024, up 0.6% year-over-year.

Market Data | Mar 14, 2024
Download BD+C's March 2024 Market Intelligence Report
U.S. construction spending on buildings-related work rose 1.4% in January, but project teams continue to face headwinds related to inflation, interest rates, and supply chain issues, according to Building Design+Construction's March 2024 Market Intelligence Report (free PDF download).

Contractors | Mar 12, 2024
The average U.S. contractor has 8.1 months worth of construction work in the pipeline, as of February 2024
Associated Builders and Contractors reported that its Construction Backlog Indicator declined to 8.1 months in February, according to an ABC member survey conducted Feb. 20 to March 5. The reading is down 1.1 months from February 2023.


